
 Newsletter
In the wake of climate change and the associated immense cost consequences, ever stricter environmental laws are coming into force worldwide. Sustainable behavior has long since become a megatrend and permeates society and the economy in equal measure.
In this detailed article, we want to show you what impact buying “green equities” actually has on the environment, whether you have to compromise on returns and which “green equities” in the form of sustainable ETFs we consider to be particularly attractive for Swiss investors.
Contents
- Focus on ETFs
- What type of investor do we want to address?
- How strong is the effect on the environment if I buy “green shares”?
- What categories of “green shares” are there?
- Market overview and performance of ETFs with “green shares”
- How do “green shares” pay off in the long term?
- Will there (soon) be a special premium for ETFs with “green shares”?
- Conclusion
- This might also interest you
- Disclaimer
Focus on ETFs
Anyone familiar with our blog knows that we follow a passive, low-cost, broadly diversified “buy-and-hold” investment strategy. We are convinced that such a strategy is best implemented with ETFs. We have therefore deliberately refrained from analyzing and evaluating individual stocks.
– Partner Offer –
Green equity ETFs are still niche ETFs. The Swiss pioneer broker Swissquote (Review) offers the widest range in this respect for Swiss investors, including the products examined here.

– – – – –
What type of investor do we want to address?
This report is aimed in particular at the following groups of people:
- Consistently environmentally conscious: You already attach great importance to sustainable products in your consumption and would like to do the same with your financial investments. We show you a wide range of “green shares” in the form of sustainable ETFs.
- Green stock picker: You are already invested in “green stocks”, either because you want to support the green idea behind them and/or because you expect above-average returns from your investment. You are aware of the total loss risk of your single stock strategy, which is why you are open to more broadly diversified, sustainable ETFs, which are the focus of this report.
- Rational return hunters and trend-conscious: You are not focused on green issues and/or you consider the effects of green investments on the environment to be negligible. Nevertheless, you are convinced that companies that pursue an environmentally friendly business model and/or make above-average efforts to combat climate change are better equipped for the future and generate higher returns. Be it because they pursue a future-oriented business model, have to pay fewer environmental taxes/fines or because they simply have to take fewer reputational risks. Later, we will show you how selected sustainable indices have performed over a longer period of ten years or more compared to the corresponding reference market.
Before we take a closer look at the Swiss market and compare products and returns, let’s look at the altruistic aspect of investing in “green equities”: What do my sustainable investments actually do for the environment?
Major effects on consumption
As a consumer, the situation is clear: if you buy an organic product A from green company B, which sources the raw materials from organic farmer C, both the company and the farmer benefit financially in the form of increased sales thanks to your conscious consumer behavior. On the other hand, your money does not flow into a conventionally produced agricultural product X from company Y, which obtains the raw materials from farmer Z.
We therefore consider the influence that you as a consumer exert on the sustainable company (and therefore also on the environment) to be direct and significant.
When investing in “green shares”, a distinction must be made between the initial purchase and subsequent trading.
If you are one of the initial buyers in the initial public offering (IPO), the purchase price you pay flows directly into the equity of the newly listed company. The company can use “your” money to invest in production facilities, for example, enabling it to implement its strategic growth and expansion targets.
In the case of investments in connection with an IPO of a green company, we also consider the effect generated to be direct and large.
But what happens after the IPO or in regular stock market trading? In this case, the “green share” merely changes hands. The money therefore flows from the buyer of the shares to the seller of the shares. This means that the company in question does not benefit directly from your investment.
And yet: even after the IPO, there are advantages for the sustainable company that should not be underestimated. This is because the stock market value of these companies increases as demand for “green shares” rises. And this is associated with the following five positive effects, which can be clearly observed in the case of electric car pioneer Tesla, for example:
- Easier fundraising: The green company can realize a capital increase with a relatively small number of new shares. A positive share price trend therefore makes it easier for companies to raise capital by means of a capital increase.
- More favorable loans: The company receives more attractive conditions on the credit market. This is because a high share price indicates a prospering company with solid key figures and positive business development.
- Better image: A company’s reputation generally increases as its share price rises. It is an expression that the underlying business model is successful. A good image is not only important for expanding the customer base, but also for recruiting the best talent on the job market.
- Protection against hostile takeovers: The higher the share price, the deeper an interested buyer has to dig into their pockets. Thanks to the high demand for Tesla shares, the electric car pioneer has entered the top 10 of the world’s largest companies by market capitalization. The takeover candidate is therefore no longer Tesla, but rather traditional car manufacturers such as Daimler & Co.
- Stability through satisfied shareholders: If the owners are rewarded with steadily rising share prices, the shareholders are generally more conciliatory at the Annual General Meeting and are less likely to question the management or its proposals. This effect should not be underestimated, as unrest and disputes always affect a company’s reputation and disrupt corporate processes. Or take the example of Tesla: anyone who invested in this company a few years ago was rewarded with incredible share price gains. Tesla investors therefore generally accept the regular escapades of Elon Musk, a company director who is as brilliant as he is “difficult”, without grumbling.
Conclusion
If you buy “green shares” or sustainable ETFs on the stock exchange, this increases demand, which in turn causes the share price to rise, stabilize or fall less sharply. However, the purchase price does not flow into the green company, but to the share owner willing to sell (exception: IPO).
In the short term, we therefore do not see any effects for the company or the environment. In the medium to long term, however, rising share prices bring the green company advantages that should not be underestimated in terms of capital procurement and credit financing, reputation, protection against hostile takeovers and the relationship between management and shareholders.
Bringing light into the ESG jungle
In the course of researching this article, we realized how complex and opaque the labels associated with “green shares” are. It would probably take a doctoral thesis to gain an in-depth overview. We will spare you (and ourselves) such a detailed analysis with a high degree of dryness and instead focus on the main thrust of the individual labels.
The ESG triad “Environment, Social, Governance” stands above all else. Whether a share is included in a sustainable index therefore mainly depends on the extent to which these three ESG criteria are met. Below we show examples of the specific actions that can be associated with this:
“E” like Environmental
- Investments in renewable energies
- Efficient use of energy and raw materials
- environmentally friendly production
- Low emissions to air and water
“S” for social
- Compliance with core labor rights
- High standards of occupational health and safety
- fair working conditions, appropriate remuneration and training and development opportunities
- Freedom of assembly and trade union freedom
- Enforcement of sustainability standards among suppliers
“G” for governance
- Transparent measures to prevent corruption and bribery
- Anchoring sustainability management at Management Board and Supervisory Board level
- Linking Management Board remuneration to the achievement of sustainability targets
- Dealing with whistleblowing
However, the individual companies are not only evaluated according to these criteria using a points system, but are also subject to exclusion criteria.
Manufacturers of civilian firearms, controversial weapons, nuclear weapons, oil sands, thermal coal and tobacco are consistently screened out from the outset, even if they were the most socially responsible employer and had the best corporate governance.
There are different levels and characteristics within the “ESG” label. As a general rule, the higher the exclusion rate, the stricter the underlying selection process.
For example, if a sustainable index contains 400 companies and the conventional benchmark index contains 1,000, the exclusion rate is 60%. This means that 60% of the companies do not meet the ESG criteria of this sustainable index and are excluded.
Green theme funds
Naturally, the exclusion rate is highest for green theme funds and diversification is lowest. This is because the focus is usually placed on a single sector such as “renewable energies”.
Cross-sector funds
In the case of sustainable, cross-thematic ETFs and the underlying indices, the focus is on the best-in-class approach. This means that only those companies per sector are selected that meet the ESG criteria on which the index is based.
These criteria vary in strictness depending on the index. Below we have taken a closer look at the most important ESG categories of the leading index provider MSCI. (Note: Important in the sense that corresponding ETFs are available for purchase).
“SRI”
The abbreviation “SRI” (socially responsible investment) indicates a particularly strict selection process. This is demonstrated by the fact that around 75% of the companies in the corresponding indices (e.g. MSCI World SRI) that belong to the parent index (e.g. MSCI World) are screened out.
“SRI” indices are always subject to strict selection, but can differ in nuances in terms of content. There are also SRI indices with a 5% cap, as we will see later.
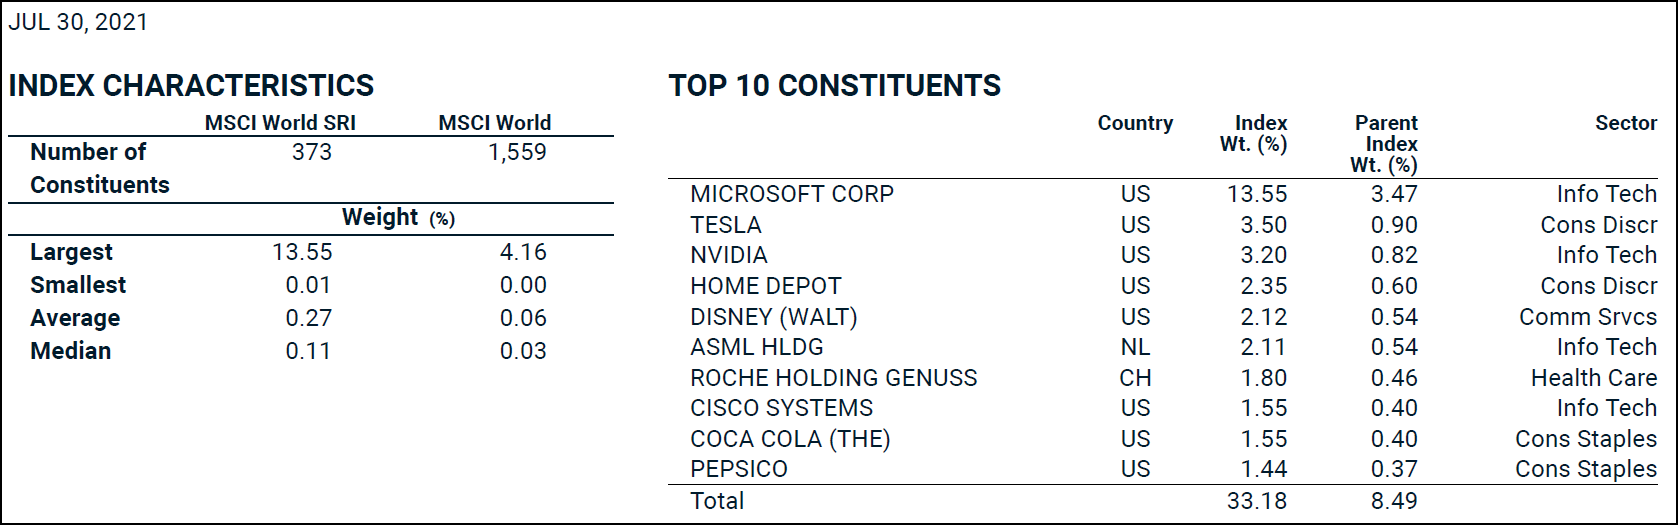
As can be seen in Figure 1, 373 of 1,559 companies are still included in the index, which corresponds to an exclusion rate of 76%. A certain diversification problem becomes apparent when looking at the 10 largest positions. Only ten “green stocks” account for a third of the market capitalization of the index, with Microsoft having by far the largest weighting at over 13%. (Apple, a slightly larger competitor in terms of market capitalization, apparently does not meet the underlying ESG criteria, which is why it is not included in this index).
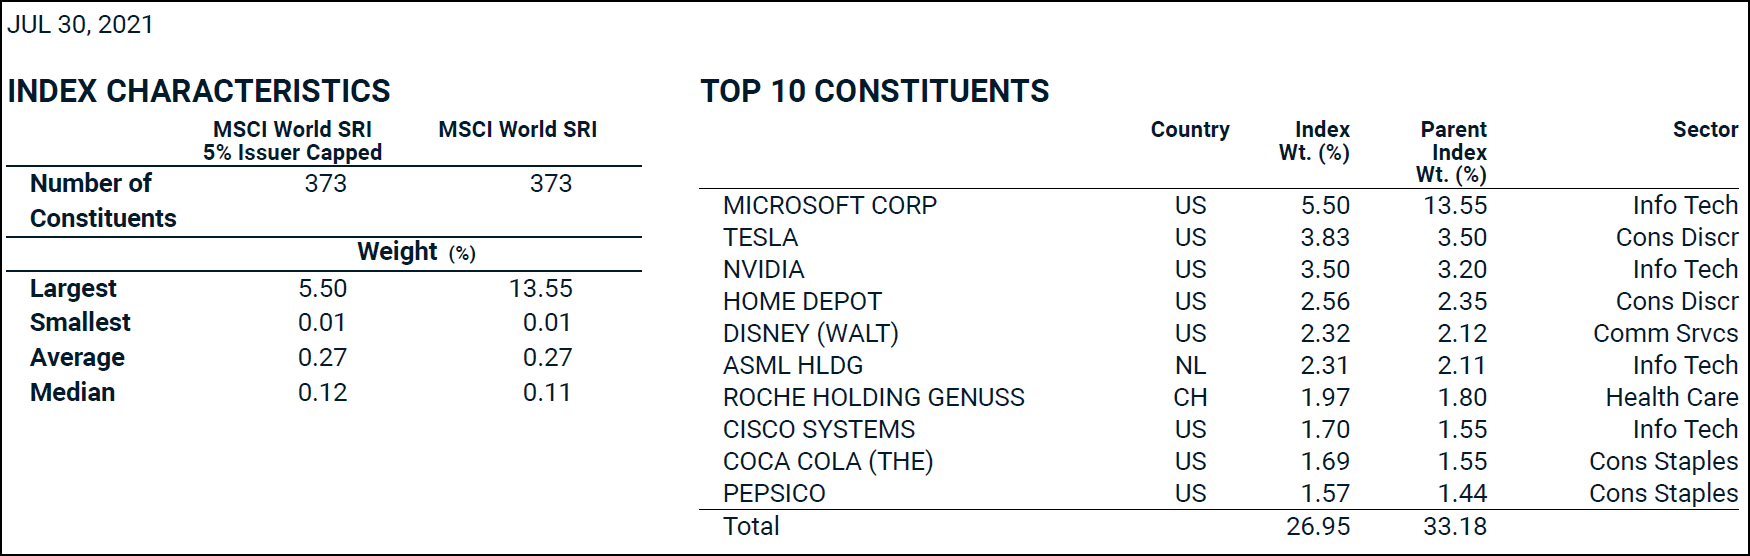
If you want to reduce the cluster risk of individual stocks such as Microsoft, choose an SRI index with a 5% cap. This means that the number and selection of companies remain the same, but no company may have a weighting of more than 5%. In this index, Microsoft’s share is significantly reduced to around 5% (see Figure 2).
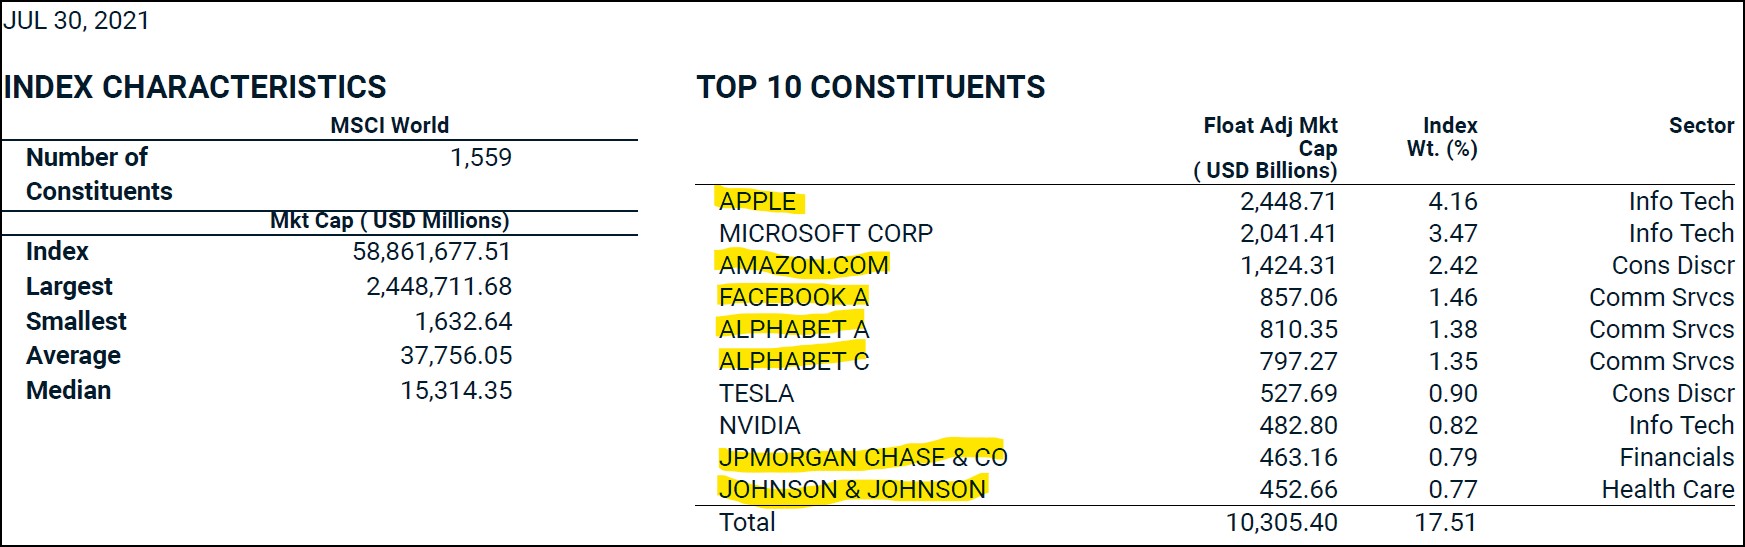
With Figure 3, we want to illustrate once again how strong the SRI selection is by highlighting all companies that are listed in the top 10 of the parent index but not in the “SRI” sub-index. This means that no fewer than seven out of ten companies fall out of the race or out of the SRI index.
If this selection is too strict or the associated diversification is too low, you can still invest in “green equities”. In this case, simply choose one of the following ESG options.
“ESG Leaders”
With a target value of 50%, the selection process for these indices is somewhat less strict.
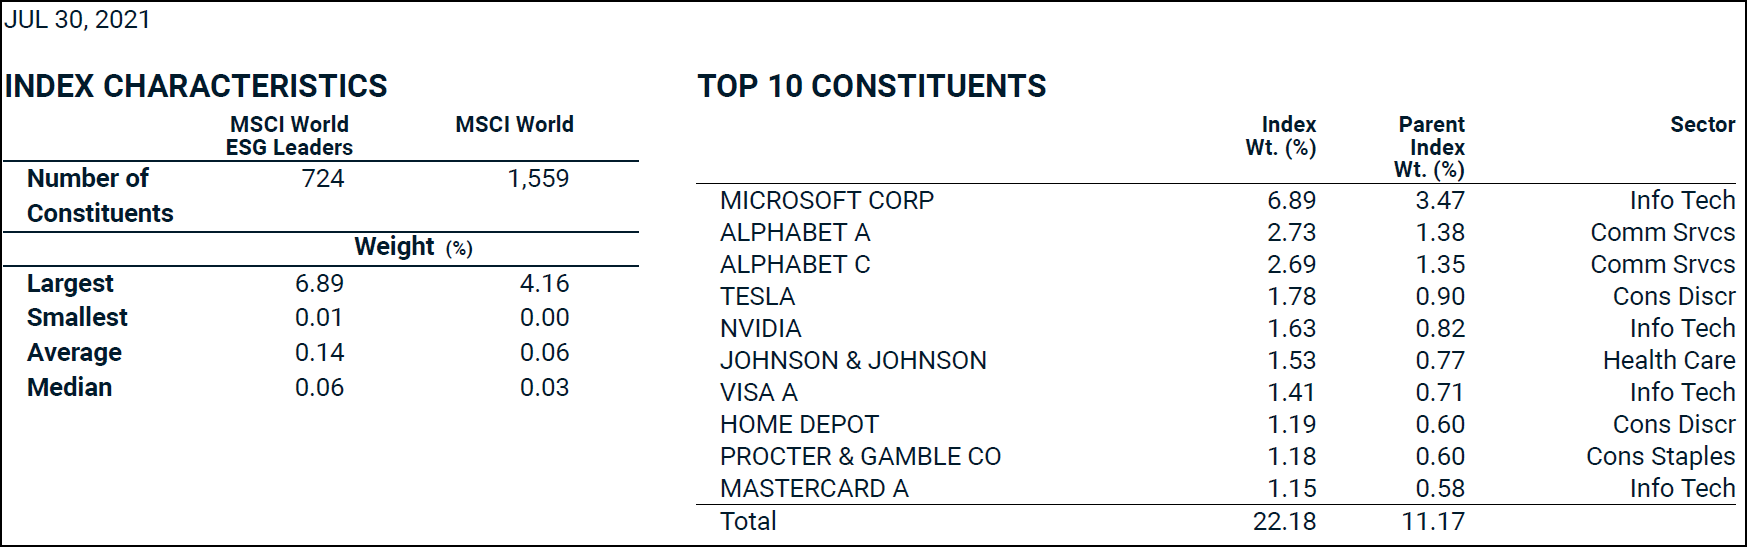
If we compare the top 10 of the parent index (see Figure 4), it is noticeable that the heavyweights Apple, Amazon and Facebook are also missing from the “ESG Leaders”.
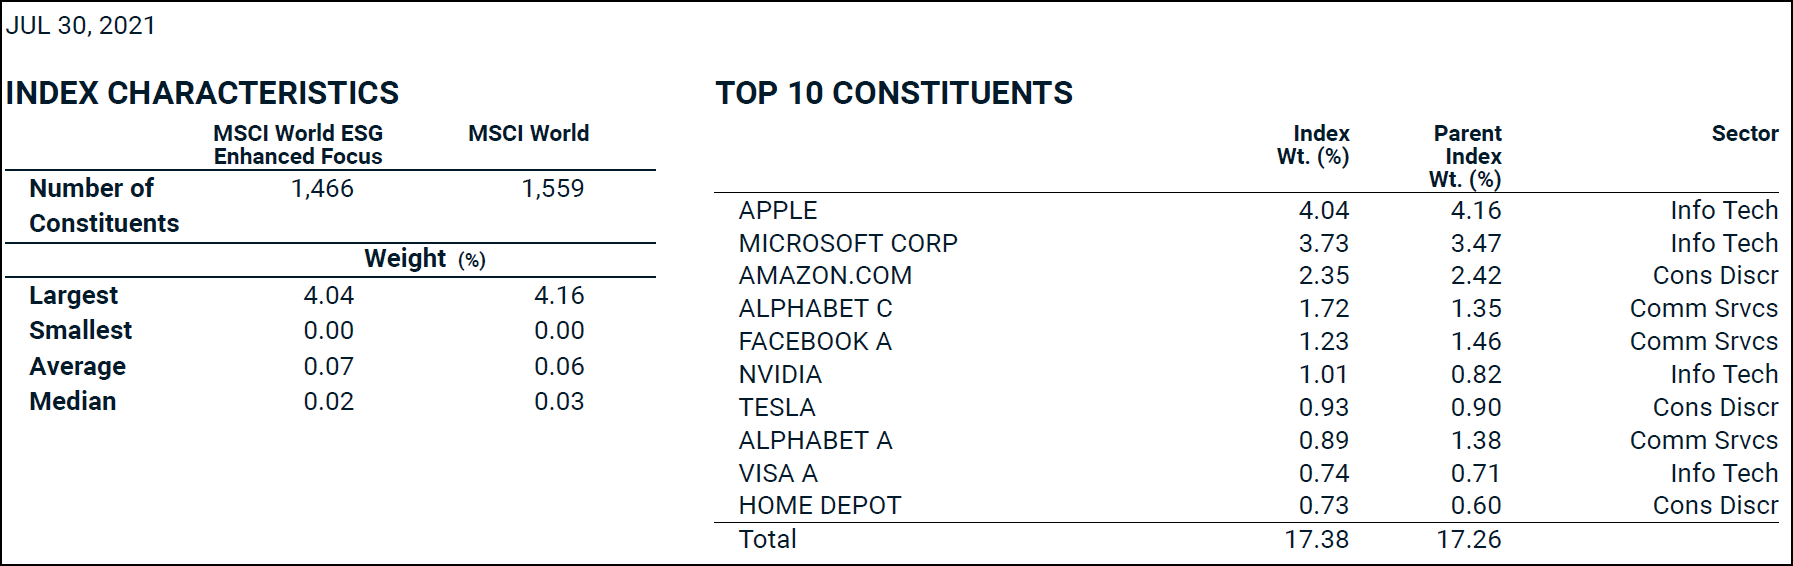
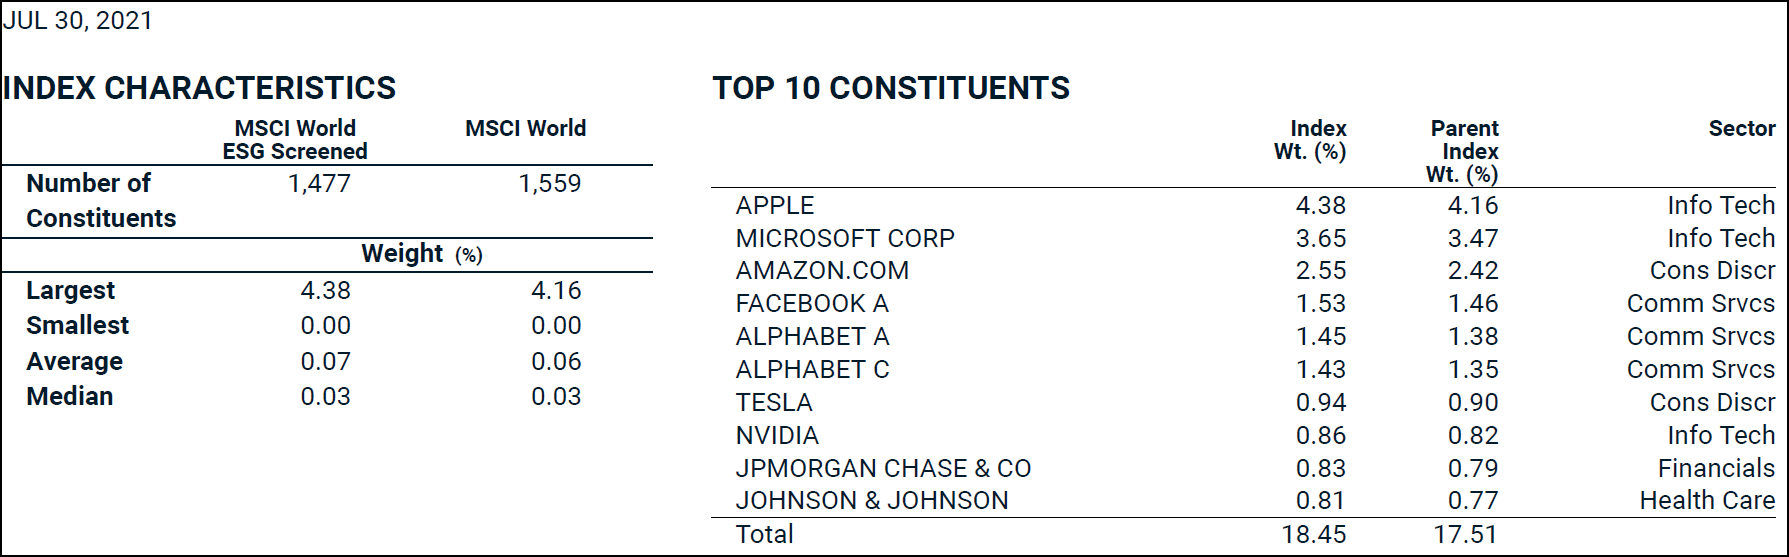
“ESG Enhanced Focus” and “ESG Screened”
As Figures 5 and 6 show, the exclusion rate for both the “ESG Enhanced Focus” and “ESG Screened” approaches is moderate at 6.0% and 5.3% respectively, while diversification remains very high.
With the “ESG Enhanced Focus” approach, an additional weighting for companies with high ESG ratings is applied in addition to the exclusion criterion (93 companies are excluded from the index). This apparently results in the developer of graphics processors and chipsets NVIDIA overtaking Tesla, which is the larger company in terms of market capitalization, or being weighted more heavily. The company Apple, which is included in these two ESG indices for the first time, is also interesting. In the stricter “Enhanced Focus Index”, however, the world’s largest company is penalized with an underweighting.
According to the “Just ETF” portal, exactly 1,000 ETFs are tradable on the SIX Swiss Exchange as at 16.8.2021, 176 of which are listed under the “Social/Sustainable” category.
Of these, we have filtered out the most established ETFs on the market (fund volume over CHF 500 million) and grouped them according to the regions “Global”, “Developed World”, “Emerging Markets”, “Europe”, “North America” and “Asia-Pacific”. Within these groups, the ETFs are sorted in descending order by exclusion ratio. This means that the “greenest” ETF is listed at the top in each case (see Figure 7).
| # | Region | ESG-Focus / Exclusion Quote | Fund name / ISIN / Reference index | No Index- Comp. | Fund Currency. | Fund size in CHF million | Costs TER p.a. |
|---|---|---|---|---|---|---|---|
| 1.01 | Global | very strong / > 97% | Lyxor New Energy (DR) UCITS ETF / FR0010524777 / World Alternative Energy Total Return Index | 40 | EUR | 1276 | 0,60% |
| 1.02 | Global | very strong / > 97% | iShares Global Clean Energy UCITS ETF / IE00B1XNHC34 / S&P Global Clean Energy Index | 81 | USD | 5412 | 0,65% |
| 1.03 | Global | strong / 82% | UBS ETF (IE) MSCI ACWI Soc Res UCITS ETF / IE00BDR55F85 / MSCI ACWI SRI Low Carbon Select 5% Issuer Capped Index | 524 | CHF | 646 | 0,33% |
| 1.04 | Global | moderate / 13% | Vanguard ESG Global All Cap UCITS ETF / IE00BNG8L278 / FTSE Global All Cap Choice Index | 7957 | CHF | 70 | 0,24% |
| 1.05 | Global | moderate / 13% | Vanguard ESG Global All Cap UCITS ETF / IE00BNG8L385 / FTSE Global All Cap Choice Index | 7957 | CHF | 61 | 0,24% |
| 1.06 | Global | moderate / 4% | UBS ETF (IE) MSCI ACWI ESG Universal UCITS ETF / IE00BDQZN774 / MSCI ACWI ESG Universal Index | 2859 | CHF | 883 | 0,33% |
| 1.07 | Global | without | SPDR MSCI ACWI UCITS ETF / IE00B44Z5B48 / MSCI ACWI | 2965 | USD | 2666 | 0,40% |
| 1.08 | Global | without | UBS ETF (IE) MSCI ACWI SF UCITS ETF / IE00BYM11L64 / MSCI ACWI | 2965 | CHF | 1408 | 0,21% |
| 2.01 | Developed world | strong / 76% | iShares MSCI World SRI UCITS ETF / IE00BDZZTM54 / MSCI World SRI Index | 373 | USD | 914 | 0,20% |
| 2.02 | Developed world | strong / 76% | UBS ETF (LU) MSCI World Soc Res UCITS ETF / LU0950674332 / MSCI World SRI Low Carbon Select 5% Issuer Capped Index | 373 | USD | 756 | 0,22% |
| 2.03 | Developed world | strong / 76% | UBS ETF (LU) MSCI World Soc Res UCITS ETF / LU0629459743 / MSCI World SRI Low Carbon Select 5% Issuer Capped Index | 373 | USD | 3354 | 0,22% |
| 2.04 | Developed world | strong / 76% | iShares MSCI World SRI UCITS ETF / IE00BYX2JD69 / MSCI World SRI Select Reduced Fossil Fuels Index | 381 | EUR | 3326 | 0,20% |
| 2.05 | Developed world | medium / 63% | Xtrackers MSCI World ESG UCITS ETF 1C / IE00BZ02LR44 / MSCI World Low Carbon SRI Leaders Index | 577 | USD | 2376 | 0,20% |
| 2.06 | Developed world | medium / 54% | CSIF (IE) MSCI World ESG Leaders Blue UCITS ETF B / IE00BJBYDQ02 / MSCI World ESG Leaders Index | 724 | USD | 850 | 0,15% |
| 2.07 | Developed world | moderate / 6% | iShares MSCI World ESG Enhanced UCITS ETF / IE00BHZPJ569 / MSCI World ESG Enhanced Focus Index | 1466 | USD | 1253 | 0,20% |
| 2.08 | Developed world | moderate / 5% | iShares MSCI World ESG Screened UCITS ETF / IE00BFNM3J75 / MSCI World ESG Screened Index | 1477 | USD | 1256 | 0,20% |
| 2.09 | Developed world | without | iShares Core MSCI World UCITS ETF / IE00B4L5Y983 / MSCI World Index | 1559 | USD | 36386 | 0,20% |
| 3.01 | Emerging countries | strong / 88% | UBS ETF (LU) MSCI EM Soc Res UCITS ETF / LU1048313891 / MSCI Emerging Markets SRI Low Carbon Select 5% Issuer Capped Index | 170 | USD | 1031 | 0,27% |
| 3.02 | Emerging countries | strong / 87% | iShares MSCI EM SRI UCITS ETF / IE00BYVJRP78 / MSCI Emerging Markets SRI Select Reduced Fossil Fuels Index | 179 | USD | 2195 | 0,25% |
| 3.03 | Emerging countries | strong / 74% | Xtrackers MSCI Emerging Markets ESG UCITS ETF 1C / IE00BG370F43 / MSCI Emerging Markets Low Carbon SRI Leaders Index | 364 | USD | 1335 | 0,25% |
| 3.04 | Emerging countries | moderate / 9% | iShares MSCI EM ESG Enhanced UCITS ETF / IE00BHZPJ239 / MSCI Emerging Markets ESG Enhanced Focus Index | 1277 | USD | 953 | 0,18% |
| 3.05 | Emerging countries | moderate / 4% | iShares MSCI EM IMI ESG Screened UCITS ETF / IE00BFNM3P36 / MSCI Emerging Markets IMI ESG Screened Index | 3111 | USD | 1361 | 0,18% |
| 3.06 | Emerging countries | without | Xtrackers MSCI Emerging Markets UCITS ETF 1C / IE00BTJRMP35 / MSCI Emerging Markets Index | 1406 | USD | 5734 | 0,18% |
| 3.07 | Emerging countries | without | iShares Core MSCI Emerging Markets IMI UCITS ETF / IE00BKM4GZ66 / MSCI Emerging Markets IMI Index | 3227 | USD | 17501 | 0,18% |
| 4.01 | Europa | stark / 77% | UBS ETF (LU) MSCI EMU Soc Res UCITS ETF / LU0950674761 / MSCI EMU SRI Low Carbon Select 5% Issuer Capped Index | 53 | EUR | 1220 | 0,22% |
| 4.02 | Europa | stark / 77% | UBS ETF (LU) MSCI EMU Soc Res UCITS ETF / LU0629460675 / MSCI EMU SRI Low Carbon Select 5% Issuer Capped Index | 53 | EUR | 1288 | 0,22% |
| 4.03 | Europa | stark / 73% | iShares MSCI Europe SRI UCITS ETF / IE00B52VJ196 / MSCI Europe SRI Select Reduced Fossil Fuels Index | 117 | EUR | 3659 | 0,20% |
| 4.04 | Europa | stark / 73% | iShares MSCI Europe SRI UCITS ETF / IE00BGDPWW94 / MSCI Europe SRI Select Reduced Fossil Fuels Index | 117 | EUR | 713 | 0,20% |
| 4.05 | Europa | medium / 53% | Lyxor MSCI Europe ESG Leaders (DR) UCITS ETF / LU1940199711 / MSCI Europe ESG Leaders Index | 201 | EUR | 900 | 0,20% |
| 4.06 | Europa | medium / 40% | Lyxor Net Zero 2050 S&P Eurozone ... (DR) UCITS ETF / LU2195226068 / S&P Eurozone LargeMidCap Paris-Aligned Climate Index | 148 | EUR | 830 | 0,20% |
| 4.07 | Europa | moderate / 10% | iShares MSCI EMU ESG Screened UCITS ETF / IE00BFNM3B99 / MSCI EMU ESG Screened Index | 228 | EUR | 1758 | 0,12% |
| 4.08 | Europa | moderate / 5% | iShares MSCI Europe ESG Enhanced UCITS ETF / IE00BHZPJ783 / MSCI Europe ESG Enhanced Focus Index | 411 | EUR | 547 | 0,12% |
| 4.09 | Europa | moderate / 4% | iShares MSCI Europe ESG Screened UCITS ETF / IE00BFNM3D14 / MSCI Europe ESG Screened Index | 414 | EUR | 949 | 0,12% |
| 4.10 | Europa | without | UBS ETF (LU) MSCI EMU UCITS ETF / LU0950668870 / MSCI EMU Index | 236 | EUR | 1822 | 0,18% |
| 4.11 | Europa | without | iShares Core MSCI Europe UCITS ETF / IE00B1YZSC51 / MSCI Europe Index | 432 | EUR | 7017 | 0,12% |
| 5.01 | North america | strong / 80% | UBS ETF (LU) MSCI USA Soc Res UCITS ETF / LU0629460089 / MSCI USA SRI Low Carbon Select 5% Issuer Capped Index | 124 | USD | 1696 | 0,22% |
| 5.02 | North america | strong / 79% | iShares MSCI USA SRI UCITS ETF / IE00BYVJRR92 / MSCI USA SRI Select Reduced Fossil Fuels Index | 133 | USD | 6584 | 0,20% |
| 5.03 | North america | medium / 65% | Xtrackers MSCI USA ESG UCITS ETF 1C / IE00BFMNPS42 / MSCI USA Low Carbon SRI Leaders Index | 218 | USD | 2816 | 0,15% |
| 5.04 | North america | medium / 56% | CSIF (IE) MSCI USA ESG Leaders Blue UCITS ETF B / IE00BJBYDP94 / MSCI USA ESG Leaders Index | 276 | USD | 1694 | 0,10% |
| 5.05 | North america | medium / 50% | UBS ETF (IE) S&P 500 ESG UCITS ETF / IE00BHXMHL11 / S&P 500 ESG Index | 314 | USD | 617 | 0,12% |
| 5.06 | North america | moderate / 9% | Invesco MSCI USA ESG Univ. Screened UCITS / IE00BJQRDM08 / MSCI USA ESG Universal Select Business Screens Index | 568 | USD | 861 | 0,09% |
| 5.07 | North america | moderate / 7% | iShares MSCI USA ESG Enhanced UCITS ETF / IE00BHZPJ908 / MSCI USA ESG Enhanced Focus Index | 582 | USD | 2727 | 0,07% |
| 5.08 | North america | moderate / 6% | iShares MSCI USA ESG Screened UCITS ETF / IE00BFNM3G45 / MSCI USA ESG Screened Index | 588 | USD | 3466 | 0,07% |
| 5.09 | North america | without | iShares Core S&P 500 UCITS ETF / IE00B5BMR087 / S&P 500 Index | 500 | USD | 44205 | 0,07% |
| 5.10 | North america | without | Xtrackers MSCI USA UCITS ETF 1C / IE00BJ0KDR00 / MSCI USA Index | 625 | USD | 5706 | 0,07% |
| 6.01 | Asia- Pacific | strong / 76% | iShares MSCI Japan SRI UCITS ETF / IE00BYX8XC17 / MSCI Japan SRI Select Reduced Fossil Fuels Index | 65 | USD | 639 | 0,20% |
| 6.02 | Asia- Pacific | strong / 76% | UBS ETF (LU) MSCI Pacific Soc Res UCITS ETF / LU0629460832 / MSCI Pacific SRI Low Carbon Select 5% Issuer Capped Index | 94 | USD | 952 | 0,40% |
| 6.03 | Asia- Pacific | medium / 60% | Xtrackers MSCI Japan ESG UCITS ETF 1C / IE00BG36TC12 / MSCI Japan Low Carbon SRI Leaders Index | 110 | USD | 1878 | 0,20% |
| 6.04 | Asia- Pacific | moderate / 3% | iShares MSCI Japan ESG Screened UCITS ETF / IE00BFNM3L97 / MSCI Japan ESG Screened Index | 265 | USD | 743 | 0,15% |
| 6.05 | Asia- Pacific | without | Xtrackers MSCI Japan UCITS ETF 1C / LU0274209740 / MSCI Japan Index | 272 | USD | 2372 | 0,20% |
| 6.06 | Asia- Pacific | without | iShares Core MSCI Pacific ex Japan UCITS ETF / IE00B52MJY50 / MSCI Pacific ex Japan Index | 127 | USD | 2946 | 0,20% |
You can find a more detailed version with additional performance data in the following Excel file: 40_green_shares_ETFs_2021_in_comparison
For the following three reasons, we have also included Vanguard with two ETFs, even though these products have only been available since March of this year and the fund volume is still modest:
- Vanguard is the pioneer par excellence when it comes to passive, index-based investments that are also super-affordable. There are also many “bogleheads” in Switzerland for whom Vanguard is always the first choice.
- Our research has shown that the range of established ETFs in the “Global” cluster, i.e. “Developed World” and “Emerging Markets” combined, is still somewhat meagre. The two Vanguard products ideally remedy this shortcoming.
- The fact that Vanguard has finally woken up from its deep slumber when it comes to “green stocks” should be duly rewarded.
In Figure 7, we have analyzed a total of 40 sustainable ETFs. In addition, you will find eleven selected conventional ETFs (i.e. without an ESG focus) for comparison in this overview.
All of the sustainable ETFs listed in Figure 7 are compliant with the European UCITS Directive. This means that these ETFs are subject to minimum regulatory requirements such as independent supervision or mandatory information requirements for investors.
The 40 sustainable ETFs are spread across seven providers, with market leader iShares (18 ETFs) and the local UBS (10) taking the lion’s share. They are followed at some distance by Xtrackers (4), Lyxor (3), Credit Suisse (2), Vanguard (2) and Invesco (1).
In the following chapters, we will look at each region in turn, discussing the special characteristics of individual ETFs, suggesting possible combinations and comparing their performance (after deduction of costs/TER) with conventional ETFs.
Speaking of combinations and conventional ETFs: If you don’t want to compromise on diversification in your investment and still want to set green accents, it is best to combine the sustainable ETF with the conventional ETF. This means you are invested with a higher weighting of “green stocks” in the overall market. We refrain from mentioning this variant again in the detailed regional analysis below.
If you want to cover the whole world with a sustainable ETF, there are six products to choose from, taking into account our selection criteria (see Figure 8).
The first two ETFs are weakly diversified funds on the topic of “renewable energies”. With a TER of 0.60% and 0.65% respectively, they are also the most expensive products in our comparison.
We do not like the benchmark index of the Lyxor product. It seems as if the product and the index come from the same company, which undermines the usual separation of powers between index and ETF providers.
The iShares ETF “Global Clean Energy” is characterized by its immense fund size of over CHF 5 billion (and again as much for the US market). CHF (and as much again for the US market). The fund has raised so much money in recent years that some of the originally only 30 “green stocks” have seen enormous price increases.
The index provider S&P was finally forced to pull the ripcord at the beginning of this year: The previously strict inclusion criteria were softened, allowing additional companies to be included in the index from April 19, 2021 (currently 81; medium-term target 100).
This ETF can look back on a very turbulent history anyway. In contrast to the last three years, when it performed sensationally, it was notable for its disastrous price performance in the first phase after its launch in 2007 (see Figure 9). It lost over 80% of its value within a few months. To date, it has not recovered from this short fall.
So anyone who invested back then because they wanted to be an ecological pioneer and/or (rightly) saw a megatrend in renewable energies paid a lot of lessons. Megatrend or not, there was a Nokia effect between 2008 and 2012 that affected an entire industry.
Chinese companies entered the market, while previous European top dogs such as Solarworld slipped massively into the red and ultimately went bankrupt one after the other. The immense fall in share prices is therefore due to a rigorous market shakeout.
This example clearly shows that thematic funds can be subject to very large fluctuations. We therefore only recommend such ETFs as an admixture (as the salt in the soup, so to speak; also known as a core-satellite strategy ) to a broadly diversified global portfolio.
The two Vanguard products, for example, are extremely broadly diversified with around 8,000 index components (i.e. large, mid and small caps) and can therefore be easily combined with the thematic funds mentioned above. We assume that the attractive price/performance ratio of these two relatively new products will lead to a rapid increase in fund volumes.
Anyone with higher expectations of “green equities” should choose the SRI product from UBS. In contrast to theme funds, all important sectors are covered. The 524 index components correspond to an exclusion rate of over 80 percent. We consider the costs to be fair. Compared to its two direct (conventional) competitors, this SRI ETF has performed better over the last three years.
As Figure 10 shows, the classic “MSCI World” is available in various sustainable sub-indices. The costs of all sustainable ETFs are very moderate or comparable with conventional ETFs.
The sustainable ETFs perform better in a 3-year comparison.
It is pleasing to see that as an investor who wants to set green accents, you have a wide range of sustainable ETFs available for the “Developed World” region. From the SRI products with a strong selection, to the two Leaders ETFs with a medium ESG focus, to the broadly diversified “Enhanced” and “Screened” products.
The underlying index of the first iShares ETF listed differs from that of the two subsequent UBS products only in the lack of a 5% cap (see also this chapter, subtitle “SRI”).
Even if it is not clear from the index title in Figure 10, point 2.04, this index is also based on a 5% cap according to the MSCI factsheet. This cap is currently only applied to the two indices and three ETFs (see Figure 10, points 2.02 – 2.04) for the stock market heavyweight Microsoft.
An ETF that covers the emerging markets is suitable as a combination with a sustainable “MSCI World” ETF (see next chapter).
“Green equities” – emerging markets
As Figure 11 shows, the range of sustainable ETFs on offer in the emerging markets is quite limited. Nevertheless, competition is good, as prices have fallen sharply in recent years. The first UBS product listed, for example, cost around twice as much (0.53% TER) as it does today when it was launched.
In the 3-year performance comparison, the second-listed iShares product comes out on top and also clearly outperforms the two conventional ETFs.
Either an ETF that covers the “developed world” (see previous chapter) or ETFs with regional coverage (see the three following chapters) are suitable as a combination with a sustainable “emerging markets” ETF.
As Figure 12 shows, the “Europe” region has a fairly large range of sustainable ETFs. It should be noted that, in addition to the varying degrees of ESG focus of the individual ETFs, one group covers the whole of Europe, while the other only refers to countries in the eurozone (EMU or European Monetary Union), which means that countries such as Switzerland, the UK and Norway are missing.
The prices are low with a TER of around 0.2%. In a 3-year comparison, the three sustainable ETFs outperform their conventional counterparts.
If you want to make an individual regional weighting in your portfolio, select one of the sustainable Europe ETFs and combine it with the regions “North America” (see this chapter) and “Asia-Pacific” (see this chapter) as well as with an emerging markets ETF (see this chapter).
“Green stocks” – North America
As Figure 13 shows, there is also a fairly large range of sustainable ETFs for the “North America” region.
One fly in the ointment, however, is that no sustainable ETFs are offered that also include Canadian companies. This selection therefore only relates to US companies.
Apparently, none of the ETF providers have yet felt the need to close this “market gap”. It would be great if a sustainable ETF covering the entire North American region were launched in the foreseeable future. MSCI has long since created corresponding ESG indices.
Prices are low to very low across the board (0.07%!). In a 3-year comparison, sustainable ETFs perform slightly better than their conventional counterparts.
If you want to make an individual regional weighting in your portfolio, select one of the sustainable US ETFs (unfortunately without Canada) and combine it with the regions Europe (see this chapter) and Asia-Pacific (see this chapter) as well as with an emerging markets ETF (see this chapter).
“Green equities” – Asia-Pacific
As Figure 14 shows, the “Asia-Pacific” region has only a small range of sustainable ETFs. It should be noted that only the second-listed SRI product from UBS, which is probably also the most expensive due to a lack of competition, covers the entire region. Otherwise, two ETFs are needed to cover the Asia-Pacific region.
With the exception of the UBS outlier mentioned above, prices are also low here with a TER of around 0.2%. In a 3-year comparison, sustainable ETFs perform slightly better than their conventional counterparts.
If you want to make an individual regional weighting in your portfolio, choose one or two of the sustainable Asia-Pacific ETFs and combine them with the regions Europe (see this chapter) and North America (see this chapter) as well as with an emerging markets ETF (see this chapter).
So far, we have found that in the three-year review – after deduction of costs (TER) – sustainable ETFs have tended to perform better than conventional ETFs that track the respective overall market (global, European, etc.).
38 of the 40 selected ETFs have fund assets of over CHF 500 million (exception: two Vanguard ETFs). Nevertheless, the vast majority of these sustainable products have only been on the market for a few years.
Nevertheless, in order to make a long-term performance comparison, we no longer rely on real ETFs in this chapter, but on a few selected indices whose performance and risk data were compared with those of the parent index (without ESG focus) over a period of at least ten years (see Figure 15).
These are gross returns (total return index), i.e. including dividends and excluding costs. The data refer to the reference currencies USD or EUR (I08 – I10).
Overview of sustainable indices in a 10-year comparison
Figure 15 compares the return and risk of selected sustainable indices over ten years.
Apart from the thematic fund listed first, which has performed worse over the last ten years with higher risk (see reasons in this chapter and chart in Figure 9), the picture is positive for the cross-sector indices. The sustainable indices achieved comparable or better performance and risk values than their conventional counterparts.
In the following sections, we take a closer look at the three SRI indices “MSCI ACWI SRI” (Global), MSCI World SRI (Developed World) and “MSCI Emerging Markets SRI”.
MSCI ACWI SRI vs. MSCI ACWI
Over the last ten years, the MSCI ACWI SRI has outperformed its parent index, the MSCI ACWI (10.74%), with an annualized return of 11.75%. It is striking that the excess return only really developed from 2019 onwards (see Figure 16).
Despite the lower diversification of the MSCI ACWI SRI, the risk of 13.34 in relation to the annualized standard deviation (volatility) is lower than that of the MSCI ACWI (14.01).
Unsurprisingly, the Sharpe ratio, which sets the excess return on a “risk-free” investment in relation to the risk taken (volatility), is also better for the MSCI ACWI SRI at 0.85 than for the MSCI ACWI (0.75).
MSCI World SRI vs. MSCI World
In the case of “green equities” in the developed world, we can even look back on a comparative period of almost 14 years. Here too, the performance and risk indicators for the sustainable MSCI World SRI index are better than those for the conventional MSCI World (see Figure 17).
MSCI Emerging Markets SRI vs. MSCI Emerging Markets
In the emerging markets, the annualized performance of the MSCI Emerging Markets SRI (7.07%) over the last ten years is significantly better than that of the parent index (3.97%). This outperformance was achieved with comparable risk (volatility) (see Figure 18).
Conclusion
The majority of the sustainable indices examined here have performed better than the more broadly diversified parent indices in terms of returns and risks over the long term. It should be noted that these positive performance data only reflect the past and do not represent a reliable forecast for future performance.
In our article “Is factor investing worthwhile?…” we looked into the question of what characterizes factor investments and which five factors (including small cap, value) have been scientifically confirmed to date.
As we have seen impressively in the previous chapter, ETFs with “green equities” outperform the corresponding reference market without an ESG focus.
From a scientific point of view, sustainable investments are not (yet) a new factor. This would only be the case if the excess return were to become apparent over several decades.
In contrast to the scientifically confirmed factors, it is also difficult to identify a clear filter criterion in the current, rather non-transparent selection of “green stocks”. With the “small cap” factor, for example, this is child’s play by simply filtering the companies according to their market capitalization.
Conclusion
We summarize the most important findings in the following six points:
- Indirect effect on the environment: If you invest in “green shares”, whether through sustainable ETFs or individual securities, your money does not flow into the companies in question (with the exception of IPOs). In the short term, you therefore have no effect on either the company or the environment. In the medium to long term, however, rising share prices bring the sustainable company advantages that should not be underestimated in terms of capital procurement and credit financing, reputation, protection against hostile takeovers and the relationship between management and shareholders.
- Label jungle: Not unlike the food sector, the sustainable investment market is quite complex and opaque. Complex, because the overarching label “ESG” is surrounded by various forms such as “SRI”, “ESG Leaders”, “Enhanced Focus” or “Screened”, which are subject to completely different strict selection procedures. Opaque, because the underlying points system is not transparent. Why, for example, is Microsoft included in the MSCI World SRI but not Apple? Ultimately, it is probably simply a question of trust – as with the organic bud.
- Broad product selection: You can already buy over 170 sustainable ETFs on the SIX Swiss Exchange. 38 of the 40 ETFs examined in this report have fund assets of over CHF 500 million. Such products have successfully established themselves on the market, which means that the risk of ETF closure is very low. A sustainable global portfolio can easily be put together with the ETFs examined, whether with one (Global), two (Developed World and Emerging Markets) or four to five ETFs (Europe, North America, Asia-Pacific and Emerging Markets). However, the latter option would not cover Canada. A green thematic fund “Renewable Energies” could also be considered as an addition.
- Fair prices: Thanks to well-functioning competition, the prices of sustainable ETFs have fallen sharply in recent years. A TER of around 0.20% is absolutely normal today. We therefore no longer consider the price argument against sustainable investments to be valid. The cheapest product analyzed is even available at a competitive price of 0.07%. At the other end of the scale are the two thematic ETFs with a TER of 0.60% and 0.65% respectively.
- Good performance and acceptable risk: those who have invested in sustainable, cross-sector ETFs to date have achieved better returns than their conventional counterparts in the short to medium term, without taking on greater risk in the form of higher volatility. The same positive picture emerges over the longer term and in a 10-year comparison of selected indices. Emerging markets in particular have clearly outperformed over the last ten years. However, due to their sector focus and the comparatively small number of companies, thematic ETFs are much more susceptible to volatility and are therefore only recommended as an addition to a cross-sector global portfolio (see also “Broad product selection” above).
- No factor investing: Despite excess returns, investments in “green equities” are not (yet) factors from a scientific perspective. One prerequisite for this would be a proven excess return over an observation period of several decades. The green investment market is still too young for this.
We hope that this detailed report has provided you with a useful basis for deciding whether to invest in “green shares”. What is your opinion? We look forward to your comments!
This might also interest you
Disclaimer
Disclaimer: Investing involves risks of loss. You must decide for yourself whether you want to bear these risks or not.
Errors excepted: We have written this article to the best of our knowledge and belief. Our aim is to provide you as a private investor with the most objective and meaningful financial information possible. However, should we have made any errors, forgotten important aspects and/or no longer have up-to-date information, we would be grateful if you could let us know.
Transparency note: At the time of publication, the Swiss Finance Blog team is invested in the following investments mentioned in the article:
iShares Global Clean Energy UCITS ETF / UBS ETF (LU) MSCI Emerging Markets Socially Responsible UCITS ETF (USD) A-dis / UBS ETF (LU) MSCI EMU Socially Responsible UCITS ETF (EUR) A-dis / UBS ETF (LU) MSCI Pacific Socially Responsible UCITS ETF (USD) A-dis / UBS ETF (LU) MSCI World Socially Responsible UCITS ETF (USD) A-dis / Tesla Inc. (TSLA)
Apart from these investments, there are no business relationships (commissions or similar) with any of the index or ETF providers mentioned in this report.


7 Kommentare
Vielen Dank für den informativen und interessanten Artikel.
Leider scheint die ISIN von dem folgendem von Ihnen genannten globalen ETF falsch zu sein:
UBS ETF (IE) MSCI ACWI Soc Res UCITS ETF / IE00B1XNHC34 /
MSCI ACWI SRI Low Carbon Select 5% Issuer Capped Index
Könnten Sie die ISIN für diesen ETF korrigieren und bestätigen?
Merci für den Hinweis. Die korrekte ISIN lautet gemäss UBS Produkt-Factsheet IE00BDR55F85. Wir haben die ISIN im Beitrag korrigiert.
Hi
Mit dem aktuellen Krieg vor unseren Toren hat sich die Performance SRI/ESG deutlich zu Gunsten ungrüner Werte wie zur Waffen- und fossilen Energie-industrie verschoben. Wäre toll die Performance-Werte aktualisiert bis und mit 2023 zu publizieren.
Den durchaus auch fraglichen “Greenwashing-Prozess” mal ganz aussen vor gelassen – Die Zahlen präsentieren sich anders. 😉
Grüsse
Hallo,
Was hält Ihr in der jetztigen Situation vom Kauf von ETFs oder Aktien im Bereich Wasserstoff?
Danke
Peter
Hoi Peter
Nicht viel. Wir bevorzugen breiter diversifizierte ETFs, weil sie in der Regel ein besseres Risiko-/Renditeverhältnis aufweisen.
Beste Grüsse
SFB
Liebes Schweizer Finanzblog Team
Vielen Dank für den ausführlichen Bericht zum Thema grüne Aktien
Hoi zäme
Wow, was für ein informativer Bericht. Herzlichen Dank dafür!
LG Eli