How much of your assets belong in shares – and how much stays in your bank account? The answer to this question is the most important decision when investing your money. Not the choice of the right ETF, not the perfect time to start – but the question of how you structure your assets. In this fourth lesson of our financial guide, you will find out how to determine your personal asset allocation step by step and what role your risk profile, liquidity reserve and 3rd pillar play in this.
Asset allocation – the division of your assets into a high-risk and a low-risk part – is the most important decision when investing your money.
Before you invest, you need a liquidity reserve of three to six months’ expenditure. This is not part of the asset allocation.
Your risk profile – consisting of risk appetite and risk capacity – determines the weighting. The more cautious of the two factors sets the framework.
Broadly diversified equity ETFs are at the heart of the risky part. The simplest solution: a single global ETF. If you want, you can add according to the core-satellite principle.
The low-risk part – bank deposits and possibly bonds with a high credit rating – offers hardly any return, but stability, flexibility and rebalancing ammunition.
Make a note of your target allocation. It is your fixed star – and worth more than any hot investment tip in the next stock market crisis.
What does asset allocation mean?
The term asset allocation is based on a simple idea: the structuring of your assets. Specifically, it’s about how you distribute your money across different asset classes – how much goes into shares, how much stays in your bank account, how much you put into real estate or other investments?
If diversification is the blueprint, then asset allocation – or your asset structure – is the foundation of your house. It determines how stable the building is, not the color of the walls or the model of the kitchen. Numerous studies confirm exactly this: it is not the choice of individual products, but the allocation of your assets that has the greatest influence on long-term investment success. You base all other investment decisions on your asset allocation.
Before we get into the details, it’s worth taking a look at the big picture. Your assets can be divided into three categories, each serving a different purpose: the liquidity reserve as a safety net, the low-risk portion as a source of stability, and the high-risk portion as a driver of returns.
The liquidity reserve: your safety net
Every sound financial plan includes a liquidity reserve – a nest egg of three to six months’ expenses in your bank account. This reserve serves to cushion unforeseen expenses such as job loss, illness or major repairs without you having to touch your investments.
Even if the liquidity reserve is also held in a low-risk bank account, it is not part of your asset allocation. The difference is that the low-risk portion of your investment is a conscious strategic decision within your portfolio. The liquidity reserve, on the other hand, is a requirement that must be met before you even think about investing. It is reserved for emergencies – and therefore taboo for investment purposes. The repayment of any consumer loans also has priority – their interest rates exceed any realistic investment return.
Only what remains after your nest egg and debt reduction is your freely available investment capital. And it is precisely these assets that are now structured using asset allocation.
Your risk profile determines the allocation
How you allocate your disposable assets depends on your individual risk profile – i.e. the interplay between your risk appetite and your risk capacity, which we covered in detail in lesson 2.
As a reminder: risk appetite describes how much price loss you can withstand without lying awake at night or selling in a panic. Risk capacity describes how much loss your wallet can take without you getting into financial difficulties – determined by your initial financial situation and your investment horizon.
Both factors must be in harmony. An example: You are young, earn well and could easily cope financially with a 50% drop in the share price. But at minus 20% you get nervous and sell. Then it is not your ability to take risks that is decisive, but your willingness to take risks – this sets the narrower limit. Conversely, if you consider yourself a risk-taker but want to buy an apartment in three years’ time, you should stick to the lower risk capacity. In short: the more cautious of the two factors sets the framework.
From theory to practice: dividing up your assets
Based on your risk profile, you divide your freely available investment assets into two parts: a high-risk part and a low-risk part. As a rule of thumb, the higher the proportion of equities, the higher the risk – but also the higher the return – of your portfolio.
Let’s assume fictitious fixed assets of CHF 100,000 – your nest egg is already secured. You have a regular income and have your running costs under control. Five typical breakdowns for your assets:
Risk profile
High risk*
Low risk**
Historical return p.a.***
Max. loss***
Min. investment horizon
Defensive
0-20%
80-100%
1-2%
up to -12%
0-2 years
Conservative
20-40%
60-80%
2-3%
up to -23%
3-4 years
Balanced
40-60%
40-60%
3-4%
up to -35%
5-7 years
Dynamic
60-80%
20-40%
4-5%
up to -46%
7-9 years
Offensive
80-100%
0-20%
5-6%
up to -58%
10+ years
*Stocks, optionally supplemented by real estate, commodities, cryptocurrencies, or other asset classes; **Bank deposits, and possibly high-credit-quality bonds (e.g., Swiss government bonds); ***Return: estimated real values from the perspective of Swiss investors (currency- and inflation-adjusted), based on a long-term real equity return of approximately 6% and a real return of approximately 1% for high-quality bonds, weighted by risk profile. Max. loss: based on the largest historical decline of the MSCI ACWI (–58%, Oct. 31, 2007–March 9, 2009; source: MSCI). Past performance is no guarantee of future results.
For the offensive profile, we recommend an investment horizon of at least 10 years due to the high susceptibility to fluctuations. More conservative models with a low equity component, on the other hand, are also suitable for shorter periods.
The risky part: equities in the core, additions in the satellite
The risky part is the return driver of your portfolio – and its most important component is equities.
“In the risky part, you can’t avoid stocks.“
Specifically, it fulfills four tasks:
Long-term wealth accumulation: Shares are the asset class with the highest historical returns – and compound interest ensures that your money grows exponentially over decades.
Inflation protection: While bank deposits lose value in real terms, shares offer effective long-term protection against inflation.
Participation in the global economy: With a global ETF, you benefit from the growth of thousands of companies – without having to analyze a single one.
Passive income: Broadly diversified equity ETFs pay out dividends regularly – either directly to your account or automatically reinvested, depending on the fund, which increases the compound interest effect.
ETFs that track broad market indices from all regions of the world are particularly suitable investment vehicles. You can find out why we consider ETFs to be particularly attractive when investing in lesson 6.
A global ETF as a foundation
The simplest and most elegant solution: with a single global ETF – such as the Vanguard FTSE All-World or an MSCI ACWI ETF – you invest in thousands of companies from industrialized and emerging countries, weighted by market capitalization. A single purchase, global diversification, minimal effort. This is the core idea behind passive investing – and for most investors, it’s the ideal way to get started.
Targeted additions according to the core-satellite principle
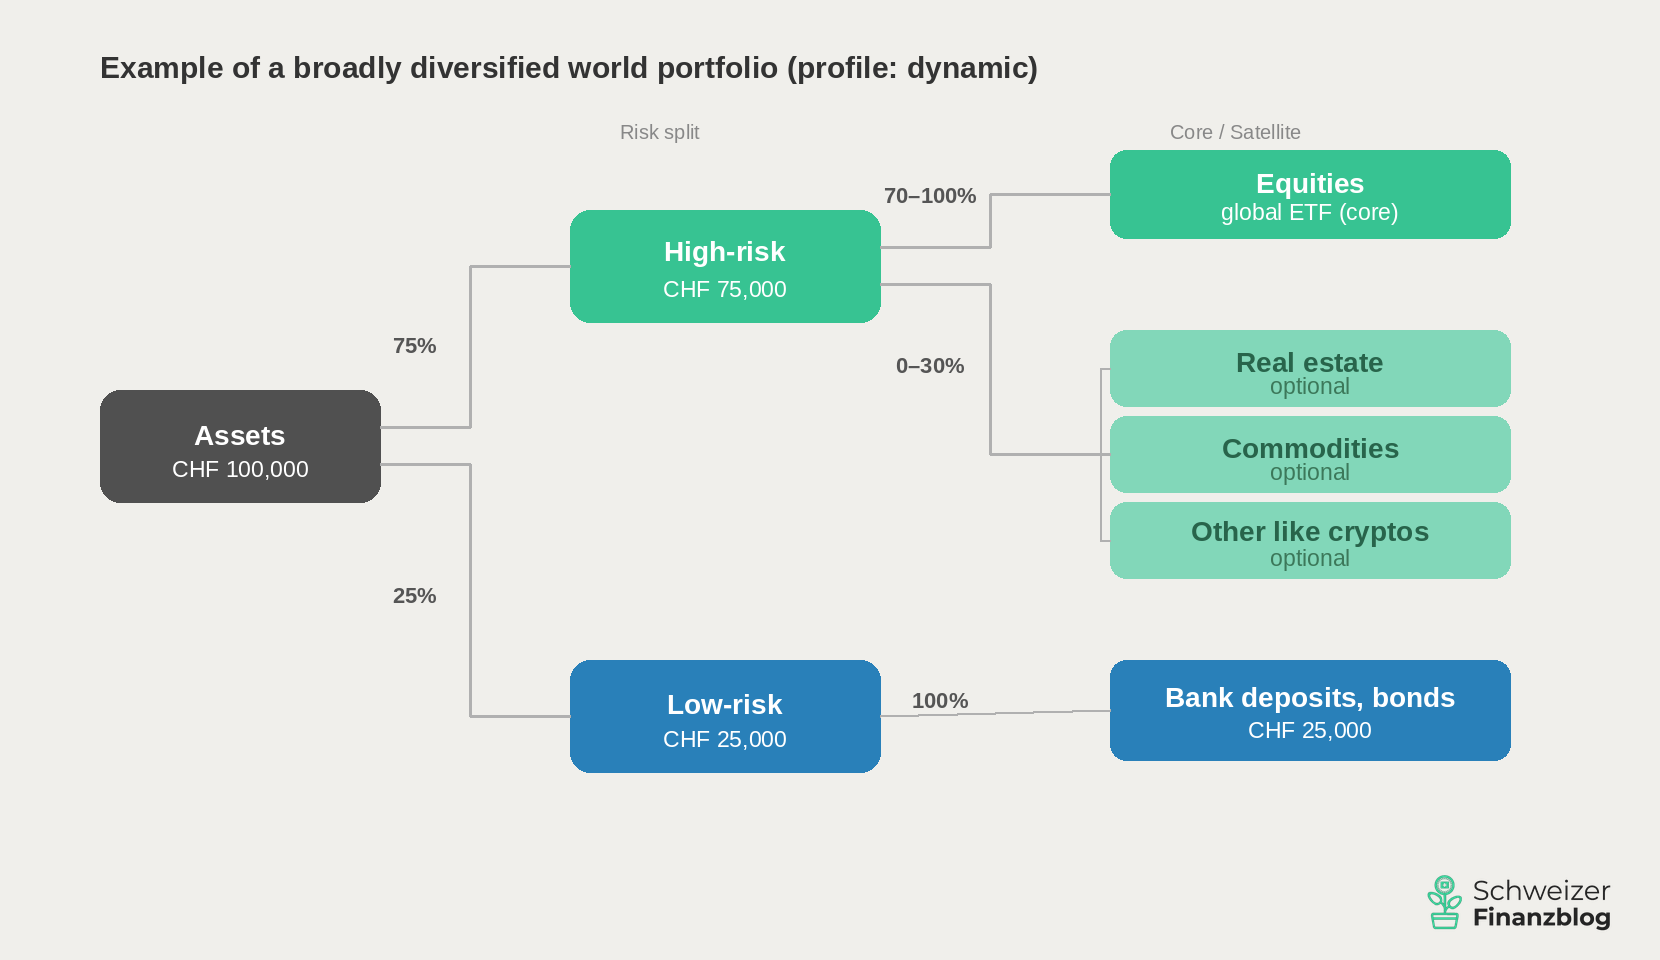
If you want to go beyond this foundation, you can apply the core-satellite approach from lesson 3. The core – 70 to 100% of the risky part – remains a broadly diversified equity ETF. If you wish, you can supplement the remainder up to a maximum of 30% in the satellite with targeted additions:
Real estate with globally diversified REITs (real estate investment trusts) can improve the risk/return ratio due to their sometimes lower correlation to the stock market.
Commodities such as gold can serve as inflation protection and a crisis buffer – but do not generate any current income.
Cryptocurrencies like Bitcoin are among the most volatile asset classes out there—if you invest in them, you should be able to withstand significant price swings and only invest money that you can afford to lose in the worst-case scenario.
Other options such as collectibles, crowdlending, factor ETFs or individual shares are conceivable for risk-takers – as a small addition, not as a core component.
Rule of thumb: the more exotic the investment, the lower its weighting.
The low-risk part: security and availability
The low-risk part is the anchor of stability in your portfolio – and the calming pill for your nerves. If the stock markets plummet by 30% again, it is this part that ensures that you remain calm. Specifically, it fulfills three tasks:
Psychological anchor: If not everything is red, it’s easier to keep going and make better decisions.
Flexibility: If your circumstances change unexpectedly – new job, relocation, unplanned expenses beyond your nest egg – you have room to maneuver.
Rebalancing ammunition: After a crash, you can buy additional shares at a low price and rebalance your portfolio (more on this in lesson 5).
Bank balances – in savings or private accounts – are the simplest and most liquid option. You can access them at any time. In Switzerland, deposits of up to CHF 100,000 per person and bank are protected by the deposit guarantee scheme. The expected return is clear: at best some protection against inflation, but no real asset growth. That’s not the purpose of this part – it’s to give you security and the ability to act.
High-quality bonds—such as Swiss government bonds with a top “AAA” rating—also offer a high degree of security. However, in Switzerland, their yields have historically been close to the inflation rate. Investors hoping for a significant return after accounting for inflation will generally be disappointed by Swiss bonds. Nevertheless, they can still serve as a stabilizing force in a portfolio—especially for investors with a balanced or conservative profile.
Other options such as medium-term notes or fixed-term deposits offer slightly higher returns than a savings account, but tie up the capital for a fixed term. You can find an overview of this in lesson 2.
“Determining your individual asset allocation tailored to your risk profile is the be-all and end-all of your investment.“
Exemplary asset structure for people with a dynamic risk profile – the second-highest of five risk levels. The core consists of a single global equity ETF (e.g. FTSE All-World or MSCI ACWI). Satellite positions such as real estate, commodities or cryptocurrencies are optional. In the low-risk section, bank deposits and, if necessary, bonds with a high credit rating provide stability. The liquidity reserve is not shown – it is not part of the asset allocation. (Source: own illustration)
And what about pillar 3a?
A question we are asked time and again: Where in my asset allocation do the 3a assets actually belong – low-risk or high-risk?
Our answer: Neither. Your 3a assets are tied pension assets – you cannot simply withdraw them if you want to. Early withdrawals are only possible in a few cases, such as when buying a home, emigrating or becoming self-employed. Pillar 3a therefore does not belong in the same drawer as your disposable assets, but follows its own rules.
But that doesn’t mean you should ignore them – on the contrary. If you still have 10, 20 or more years until retirement, you are sitting on an enormous compound interest lever. And this is precisely why we recommend investing your 3rd pillar in equities. The biggest return guzzler here? The fees. Traditional bank products often charge 1% or more per year – sounds like little, but can add up to tens of thousands of francs in lost returns over the long term. Low-cost online providers with fees of less than 0.5% make a huge difference here.
– Partner offers –
Still looking for the right financial solution? Our recommendations – with attractive starting bonuses.
– – – – –
Conclusion
Asset allocation is the most important decision in your investment – more important than the choice of individual products, more important than the time of entry, more important than the question of whether to buy ETF A or ETF B. It is your fixed star to which you align all other investment decisions.
The principle is simple: first secure your liquidity reserve. Then divide your freely available assets into a high-risk and a low-risk part based on your risk profile. In the high-risk part, broadly diversified equity ETFs are at the core – if you wish, you can supplement them with additions according to the core-satellite principle. In the low-risk part, bank deposits provide stability and peace of mind. You view your 3a assets separately – equity-based and cost-effective.
Make a note of your target allocation – so that you can monitor it periodically and take countermeasures if necessary. Because when shares rise or fall, the weighting shifts automatically. In our next lesson, we will look at how you can restore your original portfolio structure easily and cost-effectively: rebalancing.
2026-05-19: Table with historical returns and losses adjusted to CH ratios (inflation- and currency-adjusted).
2026-04-10: Article completely revised and updated.
Disclaimer
Disclaimer: Investing involves risks of loss. You must decide for yourself whether you want to bear these risks or not.
Errors excepted: We have written this article on asset allocation to the best of our knowledge and belief. Our aim is to provide you as a private investor with the most objective and meaningful financial information possible. However, if we have made any errors, forgotten important aspects and/or are no longer up to date, we would be grateful if you could let us know.
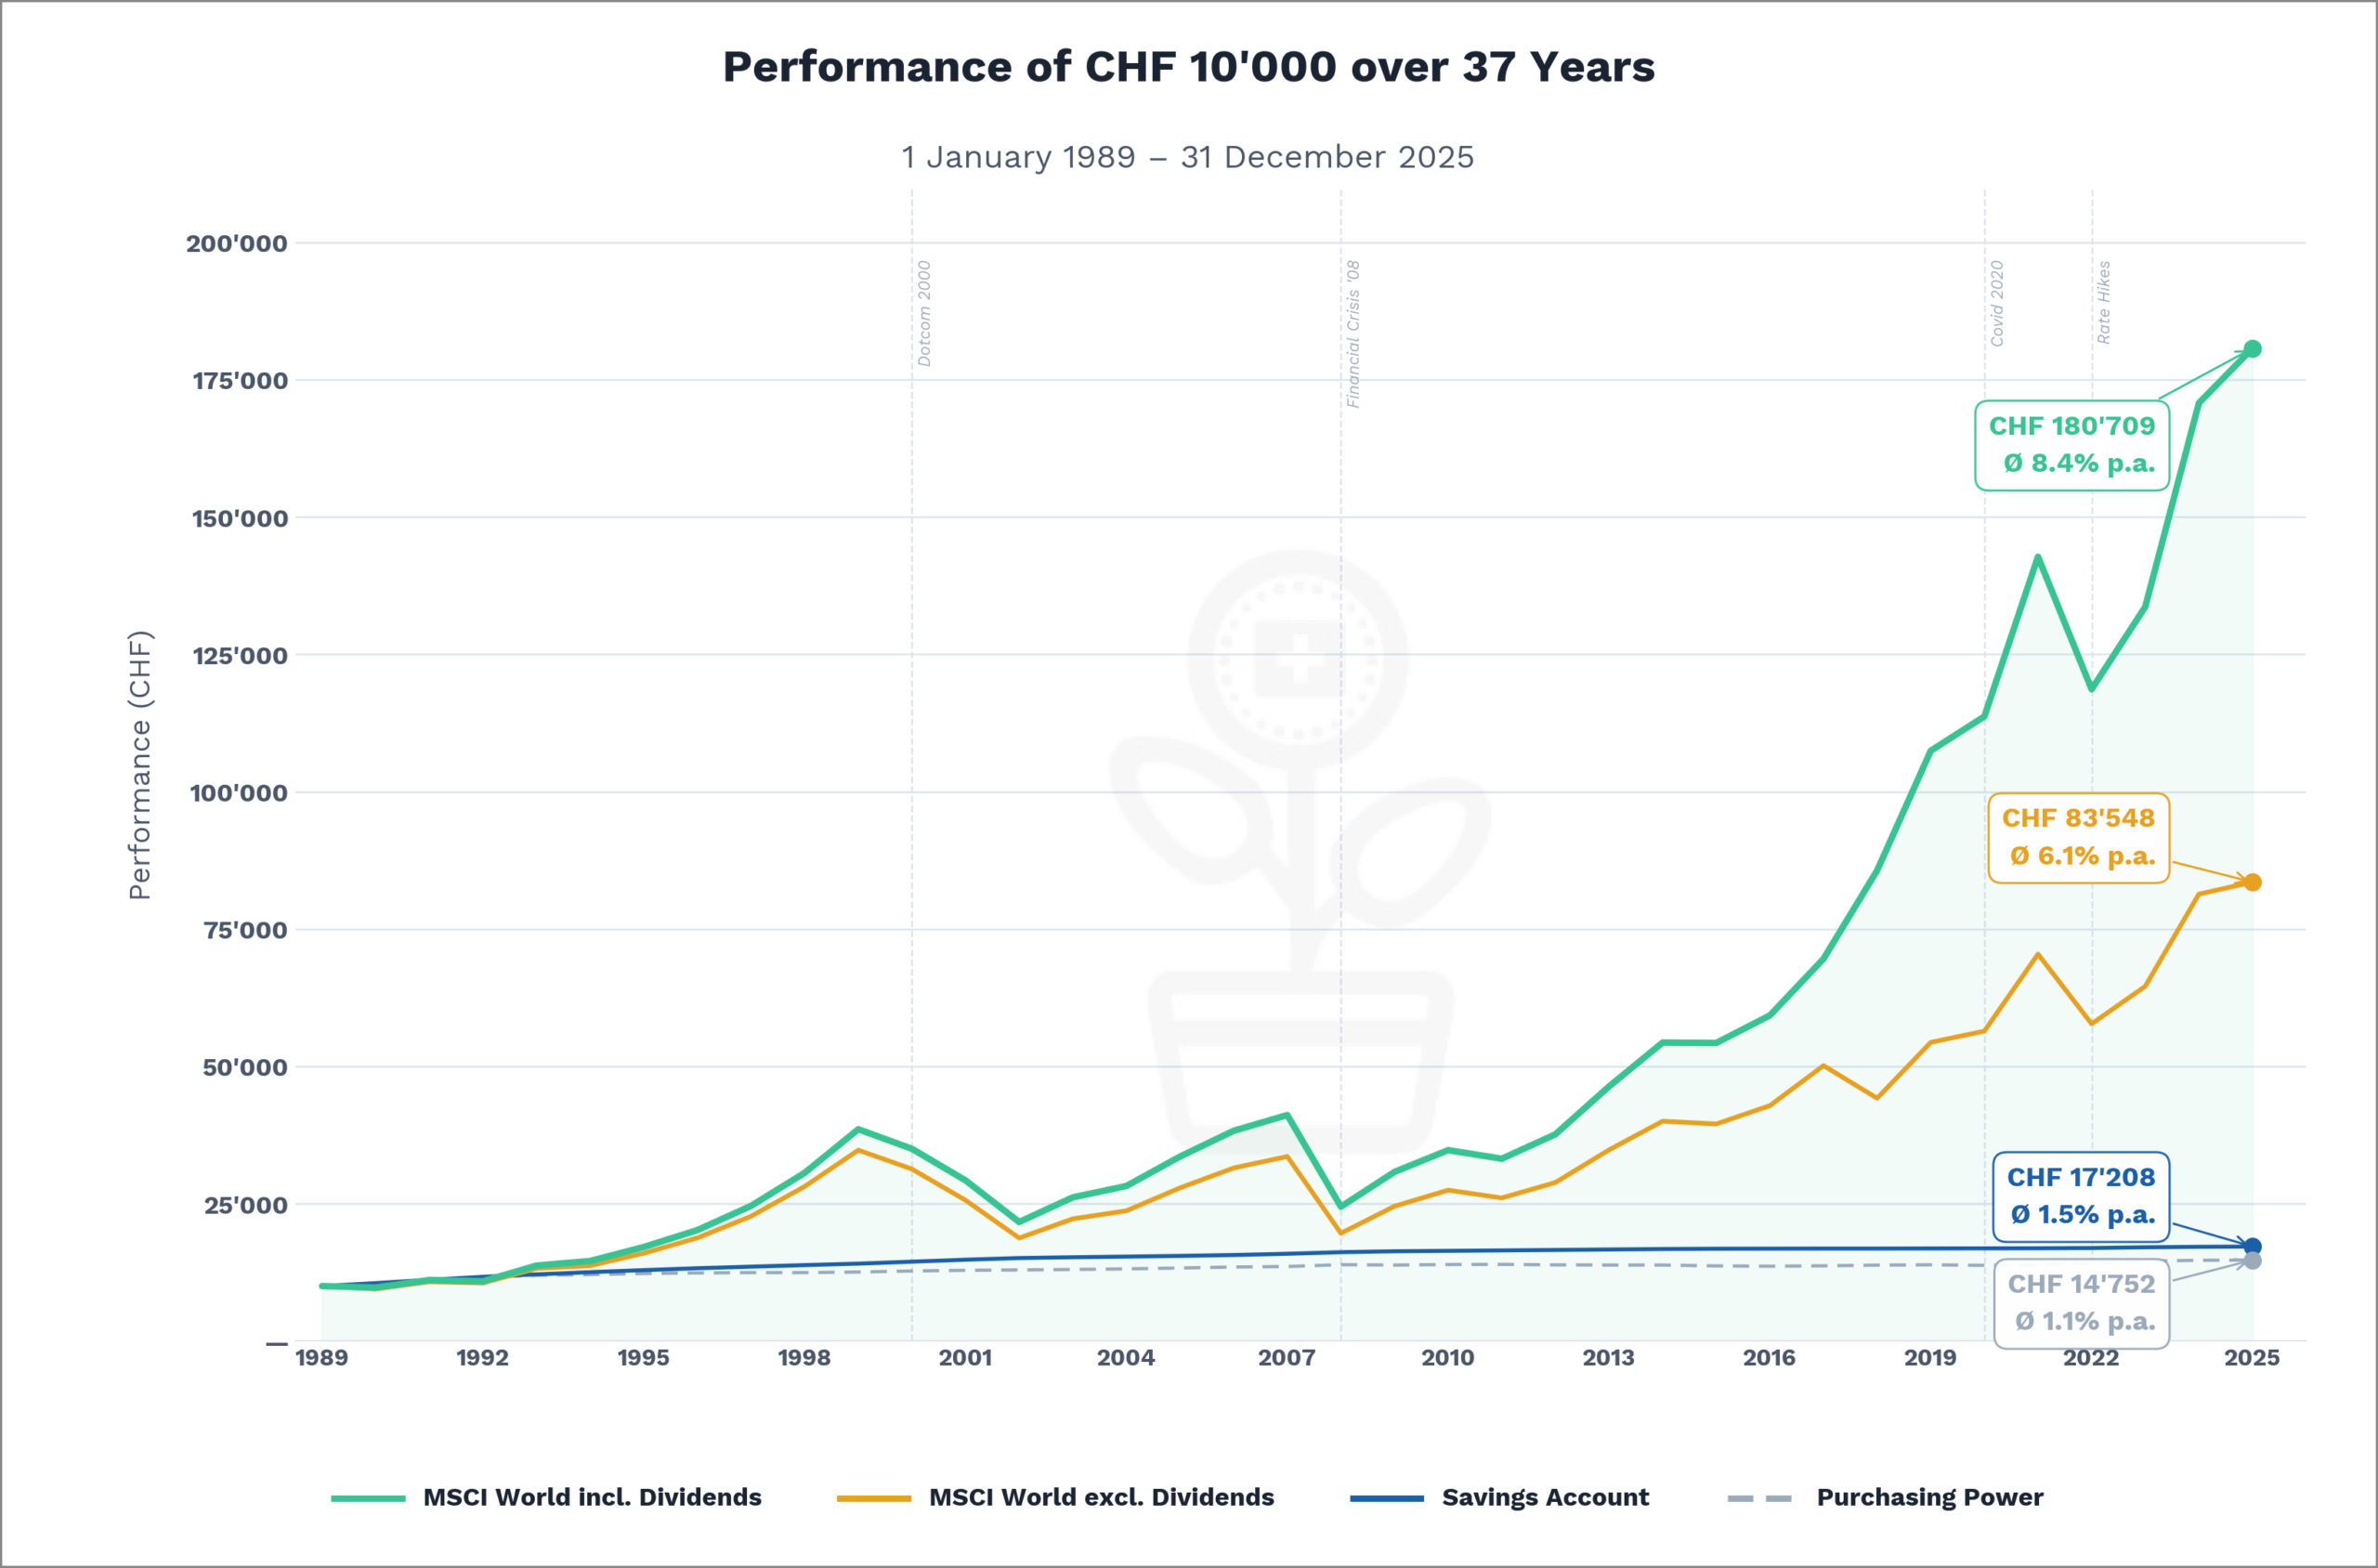
What happens if you leave 10,000 francs sitting in a savings account for several decades—and what if you invest it in a diversified portfolio of stocks? Saving feels safe. Investing money sounds risky. But if you know the numbers, you might think differently. In this article, we compare the long-term performance of a savings account with the world’s most well-known stock index, the MSCI World—using real data, concrete examples, and plain language. You’ll see why the seemingly safe choice can be the more expensive one in the long run—and what role compound interest plays in this. Welcome to the first lesson of our financial guide!
Those who have invested broadly in equities have historically been clearly ahead – around 8% per year compared to 1.5% in savings accounts, which barely beat inflation.
Compound interest makes the big difference: if you start early, you make your profits work for you.
Shares fluctuate in the short term – if you have at least ten years, you can ride out these fluctuations.
It’s not worth waiting for the perfect moment. Those who invest regularly are better off in the long term.
This first lesson shows what has been possible historically – no guarantee for the future, but a strong motivation to engage with the topic of investing.
Investing or saving money? The long-term comparison
Imagine two people. Both have saved 10,000 francs – and neither will need the money for decades to come.
Anna puts her money in a savings account. Safe, convenient, no surprises.
Beat decides to do things differently: He invests in stocks—specifically in a fund that includes the largest companies from all industrialized nations, the MSCI World. In doing so, he essentially buys a small stake in Apple, Nestlé, Toyota, and hundreds of other companies all at once.
In the end, Anna looks at her account: 10,000 has become around 17,000 francs. Not bad – if it weren’t for inflation, which has quietly eaten up most of it.
10,000 becomes 180,000 francs
Beat, on the other hand, has over 180,000 francs in his account over the same period— 18 times his initial investment, with an average annual return of 8.4%.
How is this possible? The answer lies in three factors – one of which is particularly underestimated:
Long investment horizon – time is the most important factor
High returns – equities historically yield significantly more than savings accounts
Compound interest – profits are continuously reinvested and in turn generate new profits
The uncanny power of the compound interest effect
The decisive factor is what happens to the profits. If the distributed dividends are spent every year, Beat ends up with around CHF 83,000. If, on the other hand, they are automatically reinvested, the money continues to work and in turn generates new profits. Profits on top of profits. Year after year. The result: over 180,000 francs.
The graph clearly illustrates the difference: In the top line, dividends are reinvested—allowing compound interest to work to its full potential. In the bottom line, dividends are paid out—limiting the impact of compound interest to capital gains. The gap between the two widens with each passing year.
Long-term performance comparison 1989-2025: Broadly diversified equities clearly outperform savings accounts – initially close to each other, later compound interest steadily widens the gap, even through crises. Performance of a one-off investment of CHF 10,000. MSCI World with/without reinvestment of dividends, in CHF, currency risk taken into account. Excluding taxes and transaction costs. Sources: MSCI Inc (MSCI World Total Return Index); SNB, interest rates on savings deposits; FSO, national consumer price index (CPI)
This effect is called compound interest. Albert Einstein is said to have once called it the eighth wonder of the world—and the numbers prove him right.
In the long term, we are all dead
Now you might object: I don’t have that many decades. Fair enough.
So let’s assume a shorter investment horizon—say, ten years. In our view, that’s the minimum for equity investments. This is because stocks can fluctuate wildly in the short term: in a single year (2008), the MSCI World lost over 40% of its value!
Investing money: When is the right time?
This brings us to the next tricky issue: the supposedly right time to enter the market.
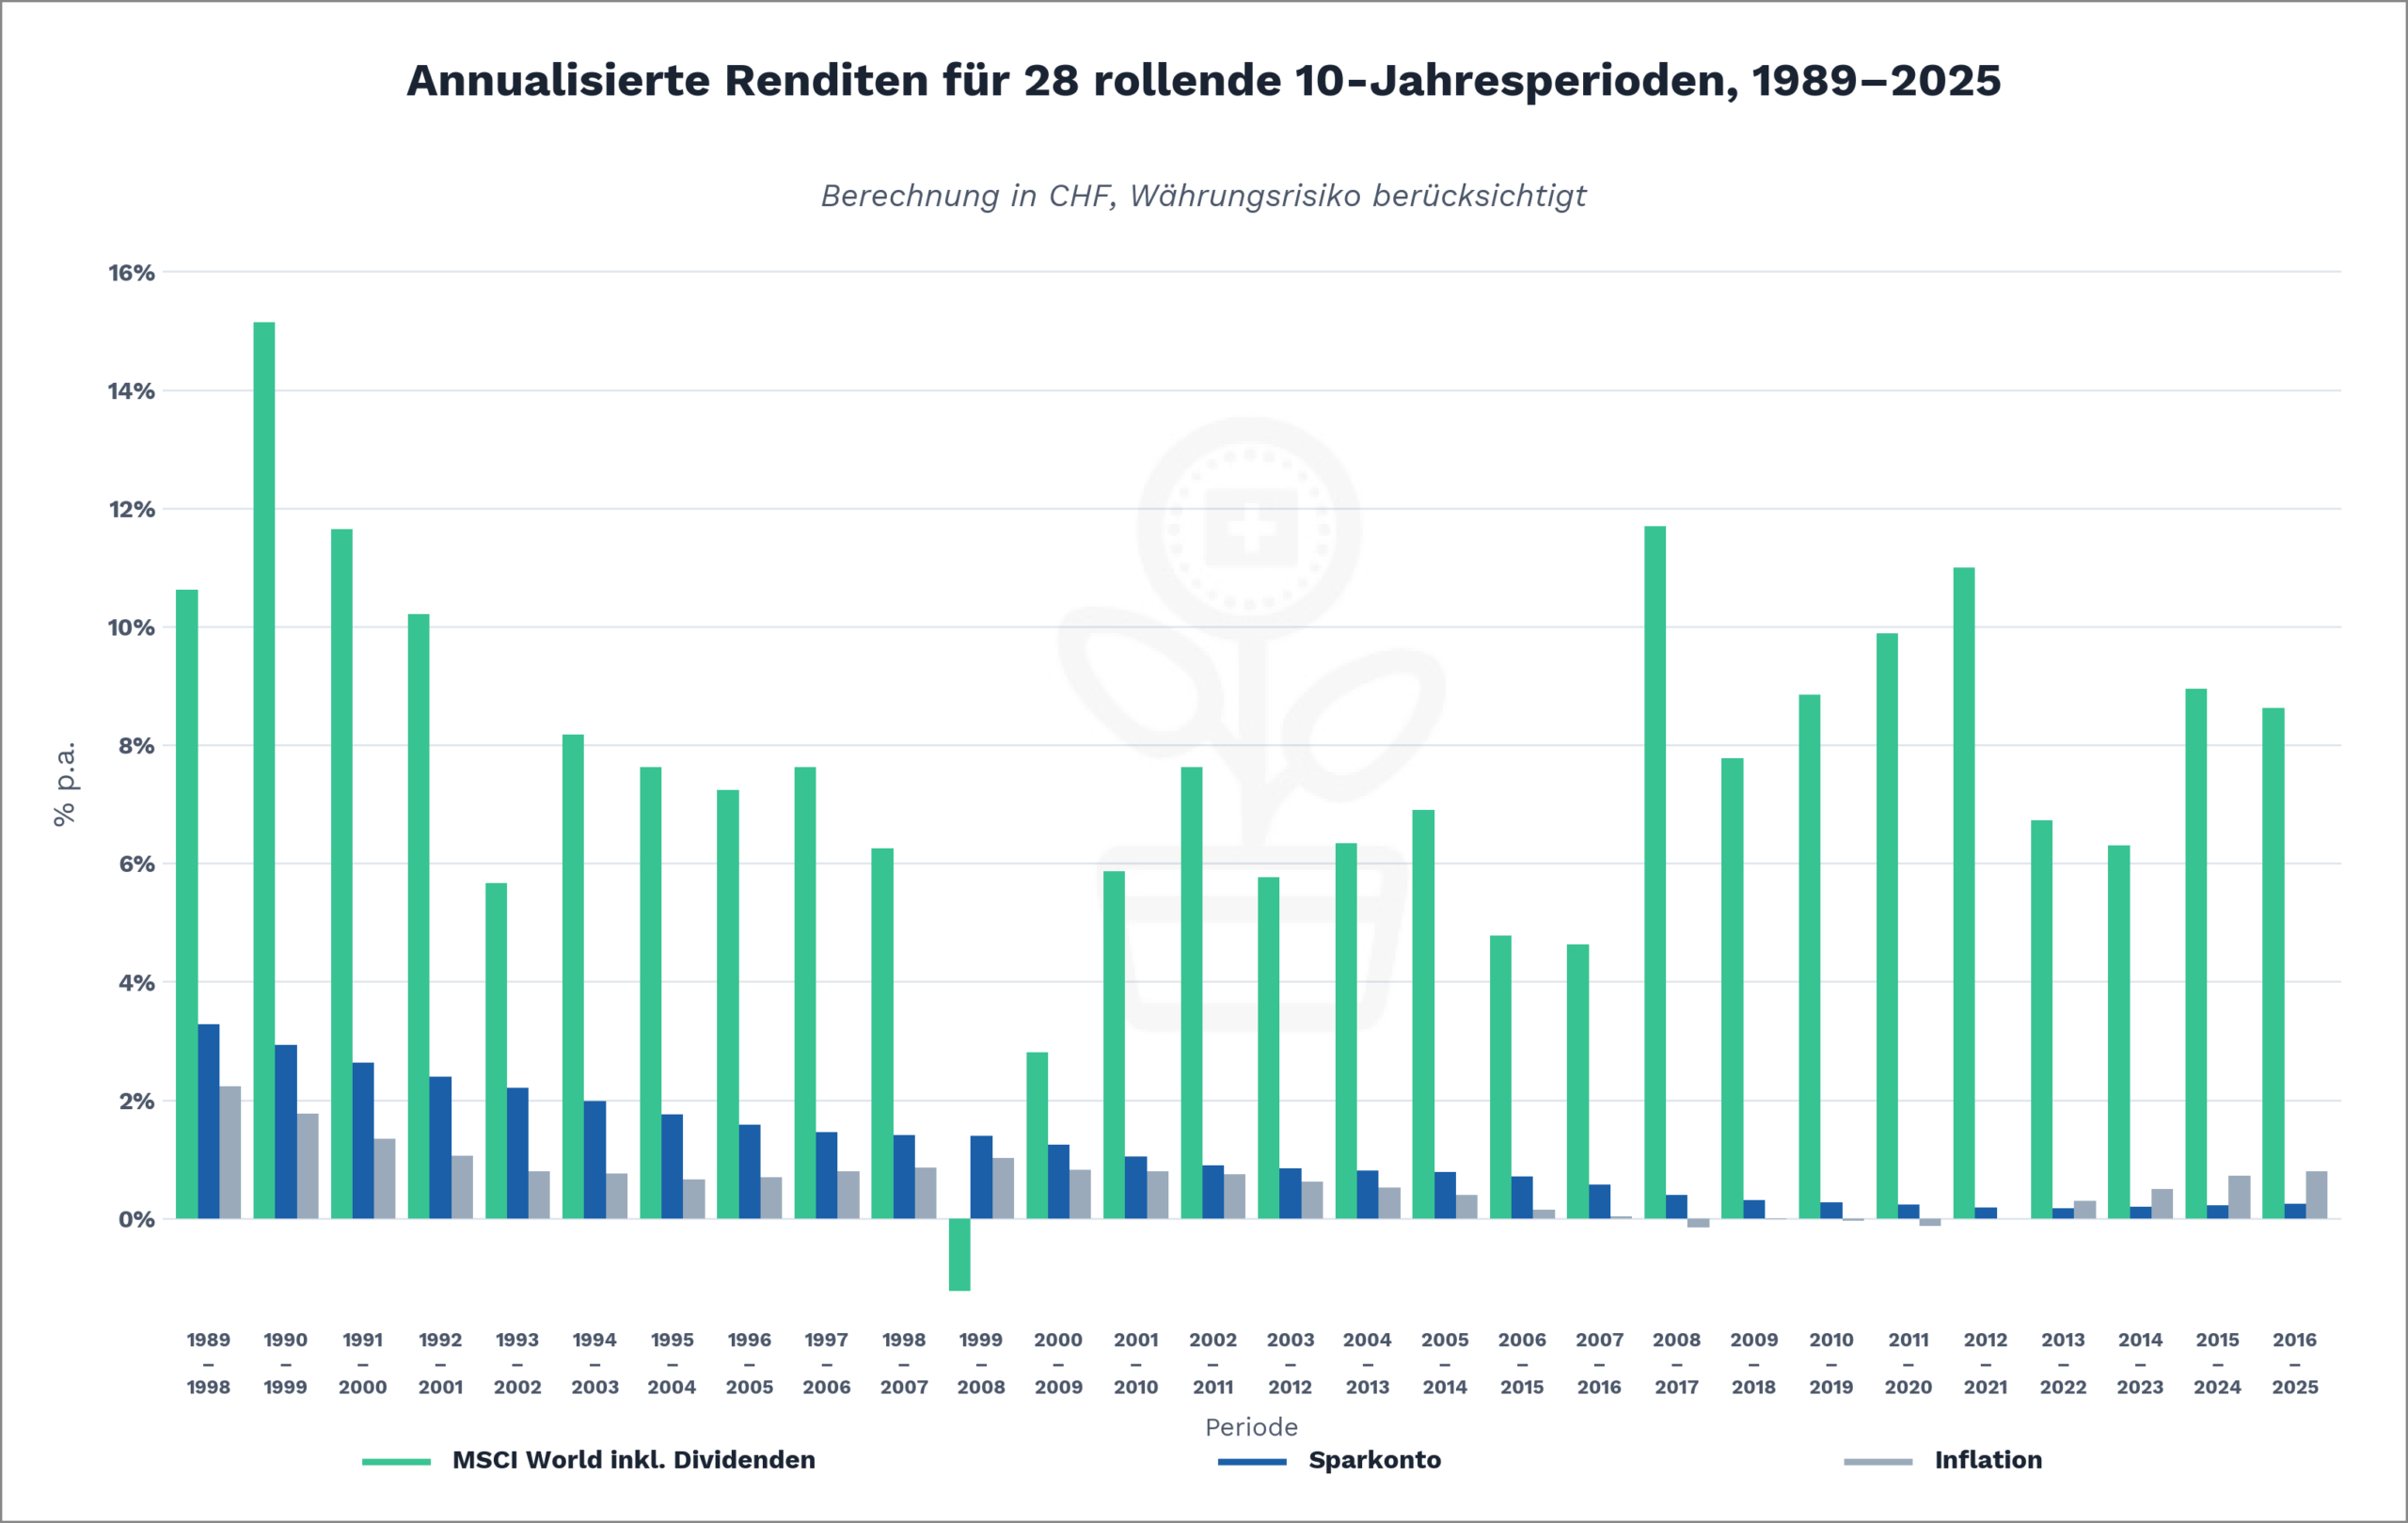
To do this, we let Anna and Beat invest their starting capital of CHF 10,000 in all possible 10-year periods since 1989 – and see what comes out of it.
We also assume that both Anna and Beat leave the income in the form of interest or dividends in their investment. This means that both benefit from the compound interest effect.
Rolling 10-year periods, 1989–2025: Investors who held their investments for 10 years consistently achieved a positive return—except during the dot-com era. Annualized return (% p.a.) per 10-year window, in CHF, currency risk accounted for. Negative inflation figures due to the SNB’s franc appreciation starting in 2015. Excluding taxes and transaction costs. Sources: MSCI Inc. (MSCI World Total Return Index); SNB, interest rates on savings deposits; FSO, National Consumer Price Index (NCPI)
In almost all 10-year periods, equity investments yield significantly higher returns than savings accounts – with just one exception.
In Anna’s case, the period 1989-1998 shines with 3.28% per year. The worst period is 2013-2022: a measly 0.17% nominal.
Beat achieved its best return in the period 1990-1999: a whopping 15.14% per year. The worst period was 1999-2008 – an annual loss of 1.23%. Twice as bad luck: Beat entered the market at the dotcom peak of all times, and the 2008 financial crisis wiped out his performance shortly before the end of the ten-year period.
The problem is that we don’t know the right time to start—and those who wait for it often wait too long. The solution is as simple as it is effective: invest money regularly instead of speculating on the perfect moment. Those who invest monthly buy sometimes at high prices and sometimes at low prices—thereby smoothing out the impact of price fluctuations over time.
Particularly striking: Starting in the 2013–2022 period, the savings account no longer kept pace with inflation. Anyone who left their money there lost purchasing power despite the nominal interest.
Please note: We have not taken currency risks, costs and taxes into account in our calculations.
The savings account is free and the fees for ETFs are minimal these days – often less than 0.2% per year. We will discuss currency risks and taxes in later lessons.
– Partner offers –
Still looking for the right financial solution? Our recommendations – with attractive starting bonuses.
– – – – –
Conclusion
The figures are clear: investing money – long-term and broadly diversified in shares – generates significantly higher returns than a savings account. Compound interest does its work silently and quietly – the longer, the more powerful. There is no such thing as the “right” time to invest – and if you wait, you lose valuable time.
This lesson has shown what was historically possible – not what is guaranteed. Whether and how you invest depends on your personal situation and your risk profile. This is what the next lessons are about.
In lesson 2, we take a closer look: What’s behind the relationship between risk and return – and why is there never one without the other?
Disclaimer: Investing involves risks of loss. You must decide for yourself whether you want to bear these risks or not.
Errors excepted: We have written this article about investing money to the best of our knowledge and belief. Our aim is to provide you as a private investor with the most objective and meaningful information possible on the subject of finance. However, should we have made any errors, forgotten important aspects and/or no longer have up-to-date information, we would be grateful if you could let us know.