The overall market beats most active fund managers. But is there a passive strategy that can outperform the overall market in the long term? Factor investing promises exactly that. We present the five best proven factor premiums, show which are really convincing – and which are disappointing in a long-term comparison.
Factor investing is a scientifically proven method of achieving a long-term return in excess of the overall market – but not a must, and if so, then only as an addition to the core portfolio.
Momentum and Quality offer the strongest premiums: around 3 percentage points annually since 1994.
The value factor is disappointing: after costs and taxes, there is hardly any talk of a noticeable premium.
Factor investing requires a long investment horizon and iron discipline – individual factors can be negative for an entire decade.
A simple global market ETF remains the cheaper and less stressful alternative.
What does factor investing mean?
Factor-based investing, smart beta investing or factor investing is an investment strategy that focuses on securities with certain characteristics – so-called factors. Numerous scientific studies, often based on research periods of several decades, prove that these factors have led to higher returns in the past. Factor-based investing therefore means the targeted overweighting of factor premiums in a portfolio compared to a market-neutral weighting. This reflects the overall market by market capitalization and is the classic passive investment strategy.
Factor investing is less suitable as a complete replacement for a market-neutral global portfolio, but rather as a targeted addition – in the sense of a core-satellite approach: the core of the portfolio remains a broadly diversified equity portfolio, while factor ETFs are added as satellites. An exclusive factor portfolio entails too great a risk: Past excess returns are no guarantee for the future, individual factors can be negative for an entire decade, and the associated investment stress should not be underestimated.
When is a factor premium involved?
Financial author Larry Swedroe and other experts have identified the following seven criteria:
Confirmation from at least several dozen independent scientists
High stability, i.e. over several decades (the more evenly distributed the factor premium, the more convincing)
Global verifiability, i.e. not focused on specific countries or sectors
Clear filter criterion, i.e. no adjustments in the definition of the factor premium
Cost-efficient realization, i.e. a factor premium should also result after costs
Comprehensibility, i.e. it is based on a logically plausible explanation
Uniqueness of the factor premium, i.e. no mere variation of an existing factor premium
In his standard work “Souverän Investieren mit Indexfonds und ETFs”, Gerd Kommer also mentions the following characteristics of factor premiums:
Factor premiums can fluctuate greatly and cannot be reliably predicted in the short and medium term.
Factor premiums are not “additive”: it is therefore not possible to simply add up the individual factor premiums in a multi-factor portfolio.
Most factor premiums become weaker after their scientific discovery, but often still high enough to result in an excess return after costs.
Factor investing incurs higher costs than comparable simple ETFs.
Factor investing only works statistically or according to the law of large numbers – not on an individual value basis.
Factor investing is compatible with the efficient market hypothesis (EMH).
Factor investing can be described as a more “active” variant of “passive” investing. The main features such as cost minimization, buy-and-hold, strict scientific orientation and mechanical rule-based investing still apply.
The most important factor premiums for equities
Five scientifically well-documented factor premiums in the “equities” asset class are presented below:
Size factor: small companies beat large ones
Value factor: cheaply valued shares beat expensive ones
Momentum factor: previous winners remain winners
Quality factor: High-quality companies beat the market
Political risk factor: emerging markets as an independent risk premium
To illustrate this, the corresponding MSCI factor index is compared with a suitable benchmark index and the long-term excess return since inception is shown. Another factor – the investment factor from Fama and French’s 5-factor model – is briefly explained as part of the quality factor, but is not dealt with separately due to the lack of suitable ETF products.
Size premium
The small-size effect states that small stock corporations (second-line stocks) have statistically higher returns than large ones. The market capitalization or stock market value of a company serves as the basis for the calculation. The index manufacturer MSCI defines the size ratios as follows: The largest companies, which account for 70% of the market capitalization of an index region, are large caps. The next 15% are mid caps. A further 14% are small caps, while the remaining 1% are micro caps. The median market capitalization of a small cap according to the MSCI World Small Cap Index was around USD 1.580 billion in February 2026. USD.
In other words: Only those who have more than 14% small caps in their portfolio can speak of a factor-based investment. This is because 14% corresponds to a market-neutral weighting.
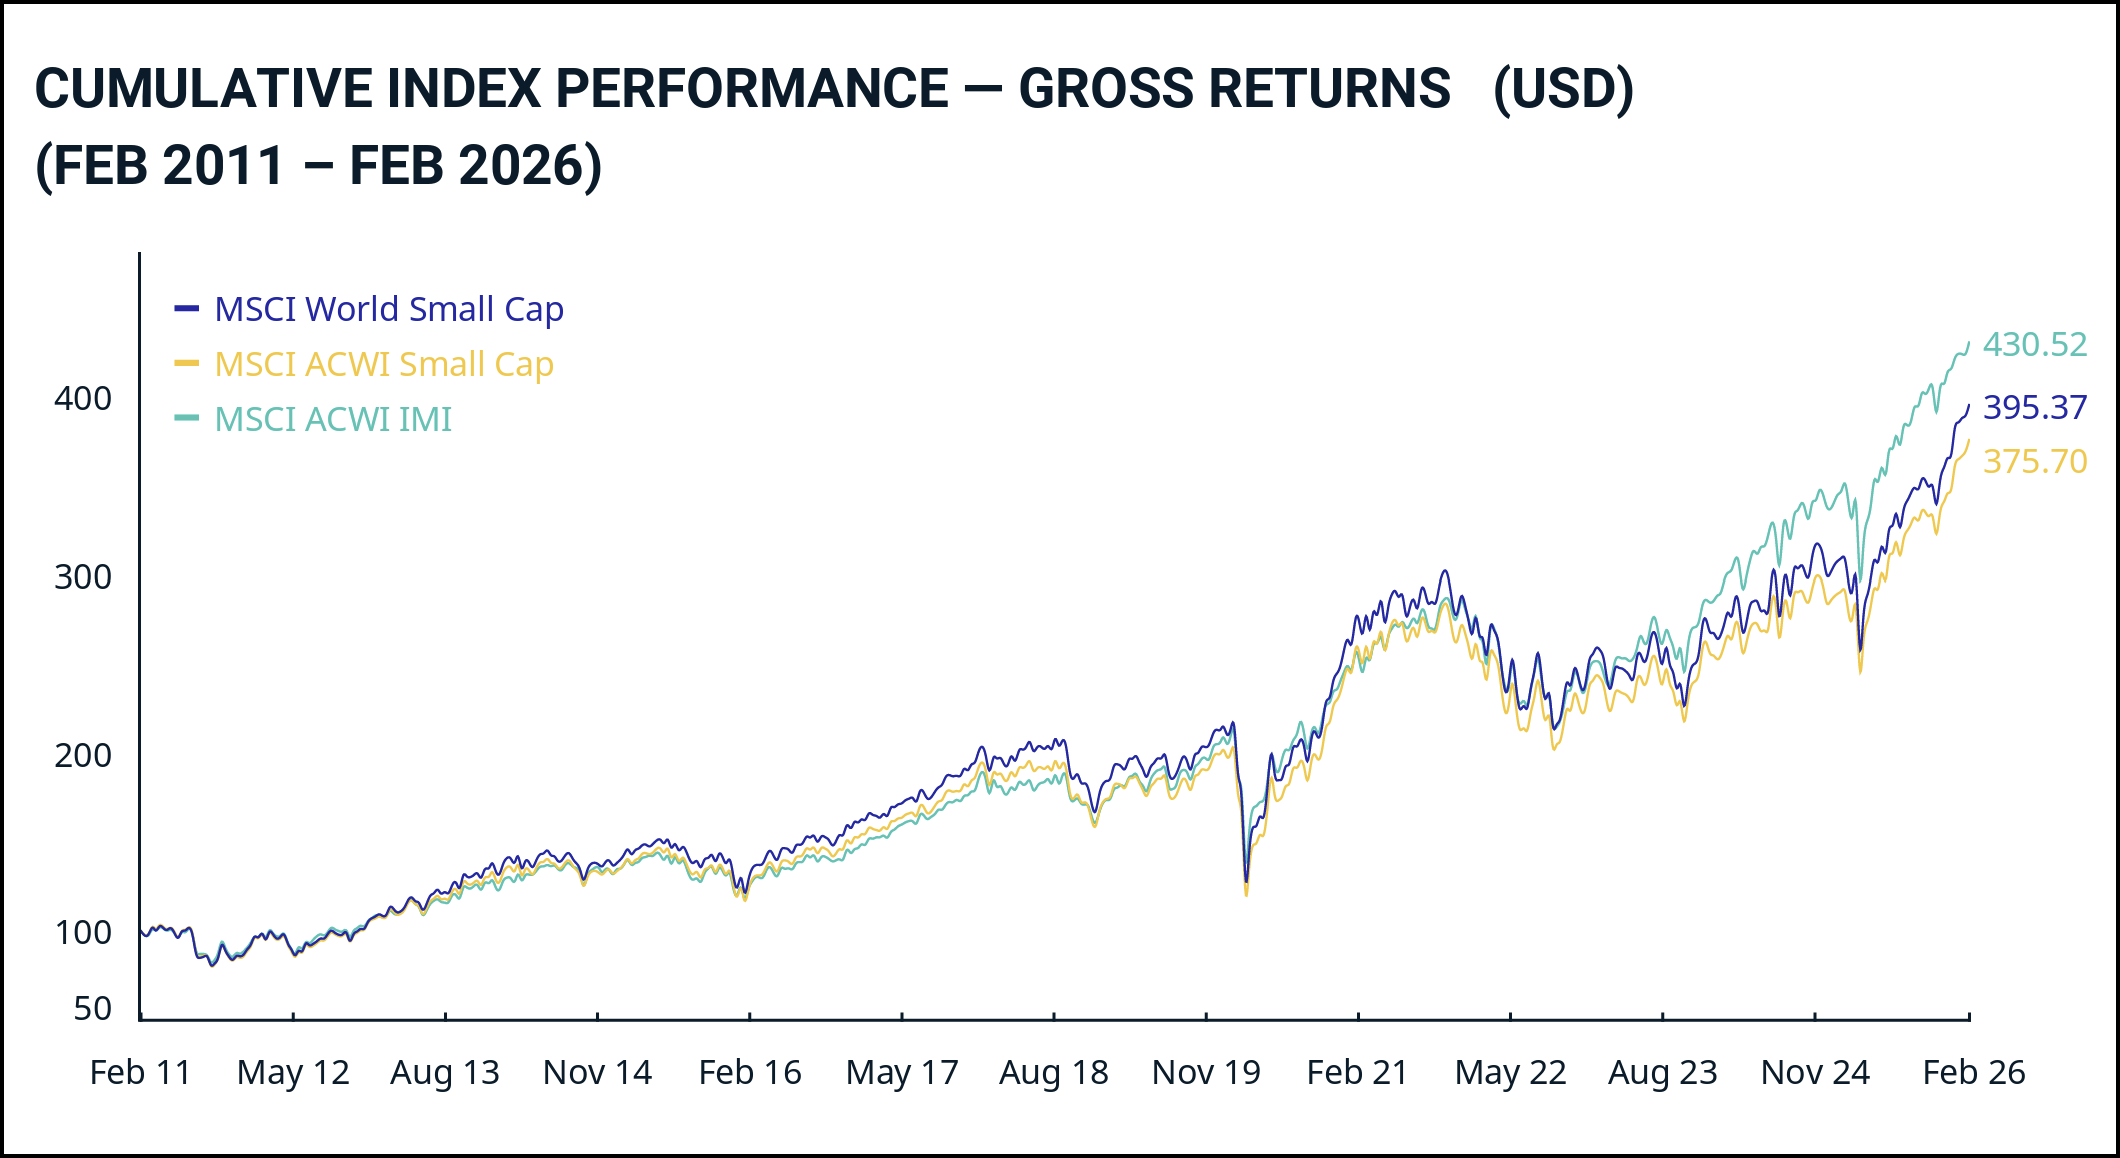
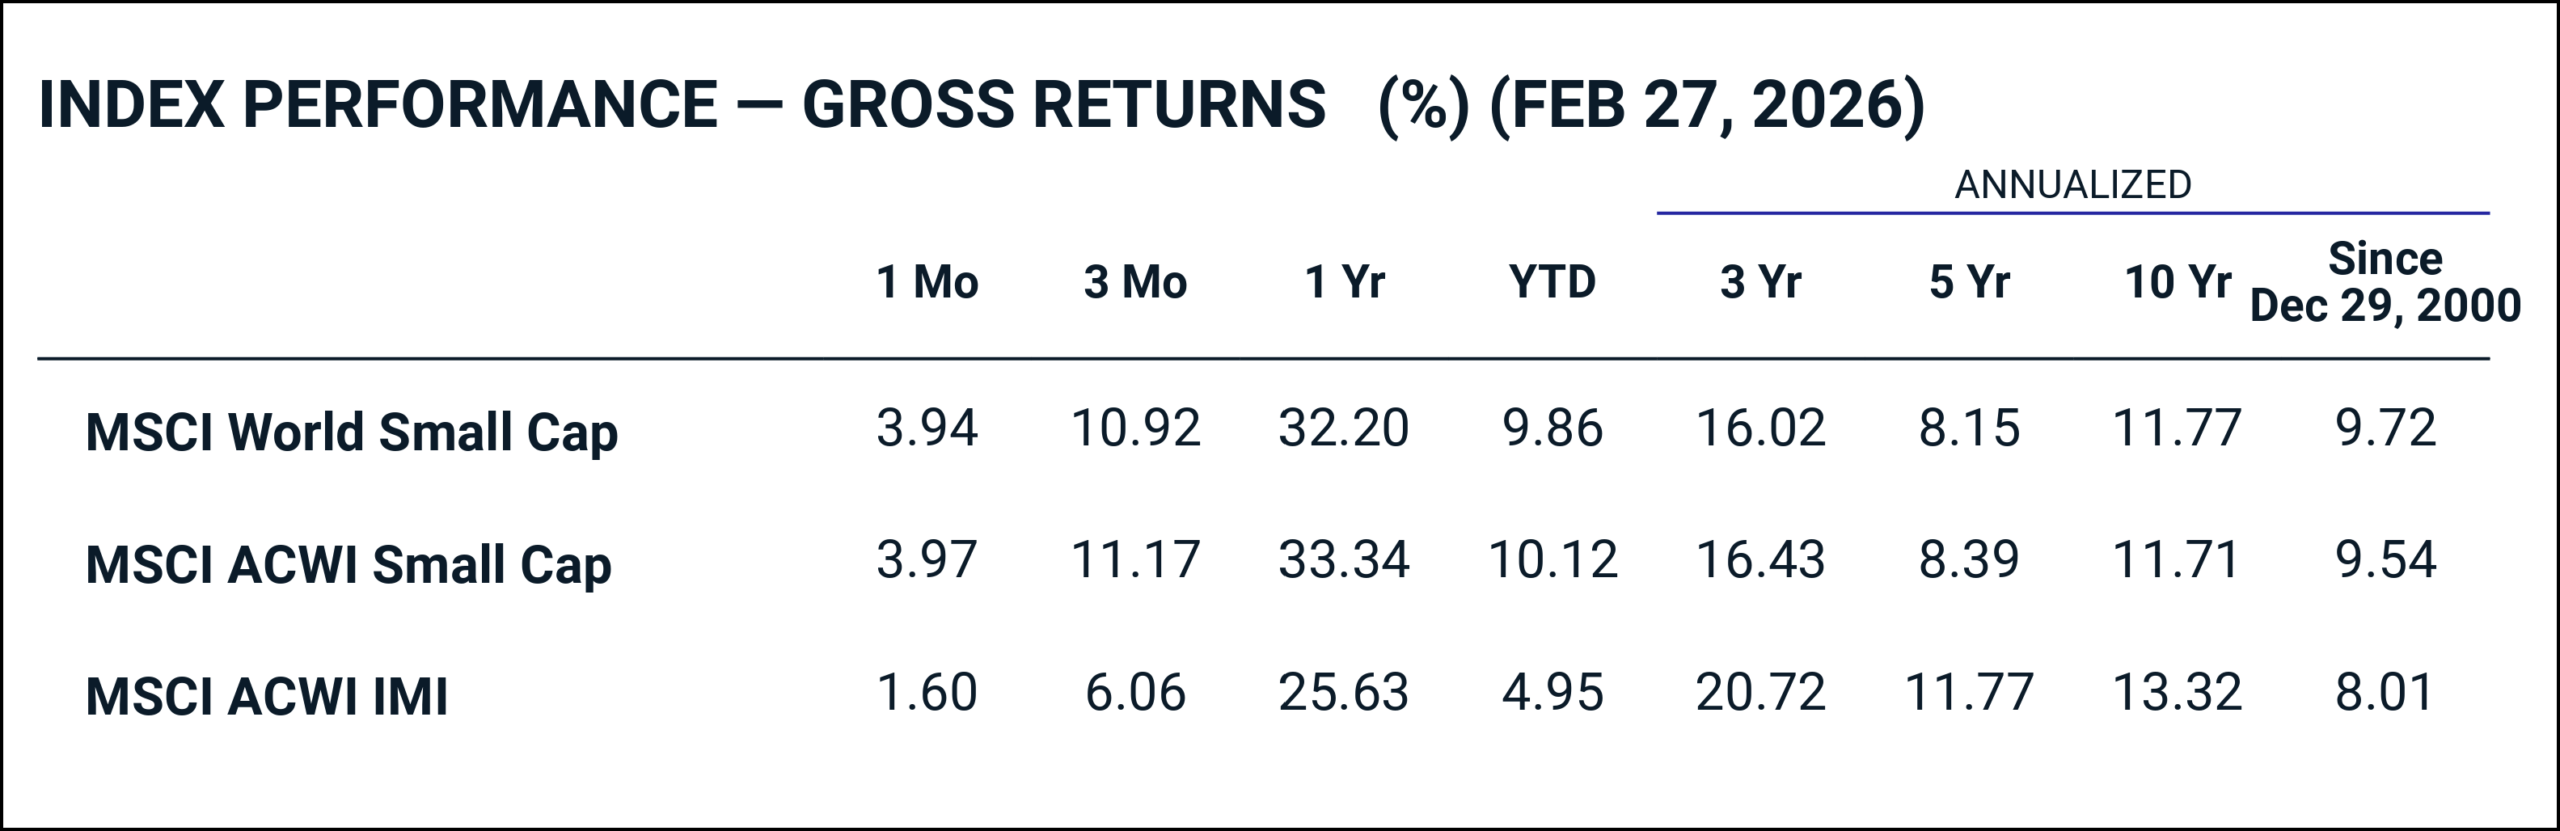
15-year index comparison between MSCI World Small Cap, MSCI ACWI Small Cap and the market-neutral MSCI ACWI IMI. Small Cap lags behind the overall market. Gross return in USD, incl. dividends and before withholding tax deduction. (Source: MSCI) Annualized gross returns as at 27 February 2026. Since the index was launched (December 2000), MSCI World Small Cap has outperformed the overall market by a noticeable 1.71 percentage points per year. (Source: MSCI)
Is the size factor worth it?
The data shows a mixed picture: over the long term since December 2000, the MSCI World Small Cap has outperformed the overall market MSCI ACWI IMI (8.01%) by around 1.7 percentage points at 9.72% p.a.. Over the last 10 years, however, small caps have underperformed the overall market by 1.55 percentage points at 11.77% compared to 13.32% – a clear example of the long dry spells you have to expect with a factor-based investment.
How to invest in the size factor
If you want to invest in the size factor, the following two products in particular have established themselves well on the market:
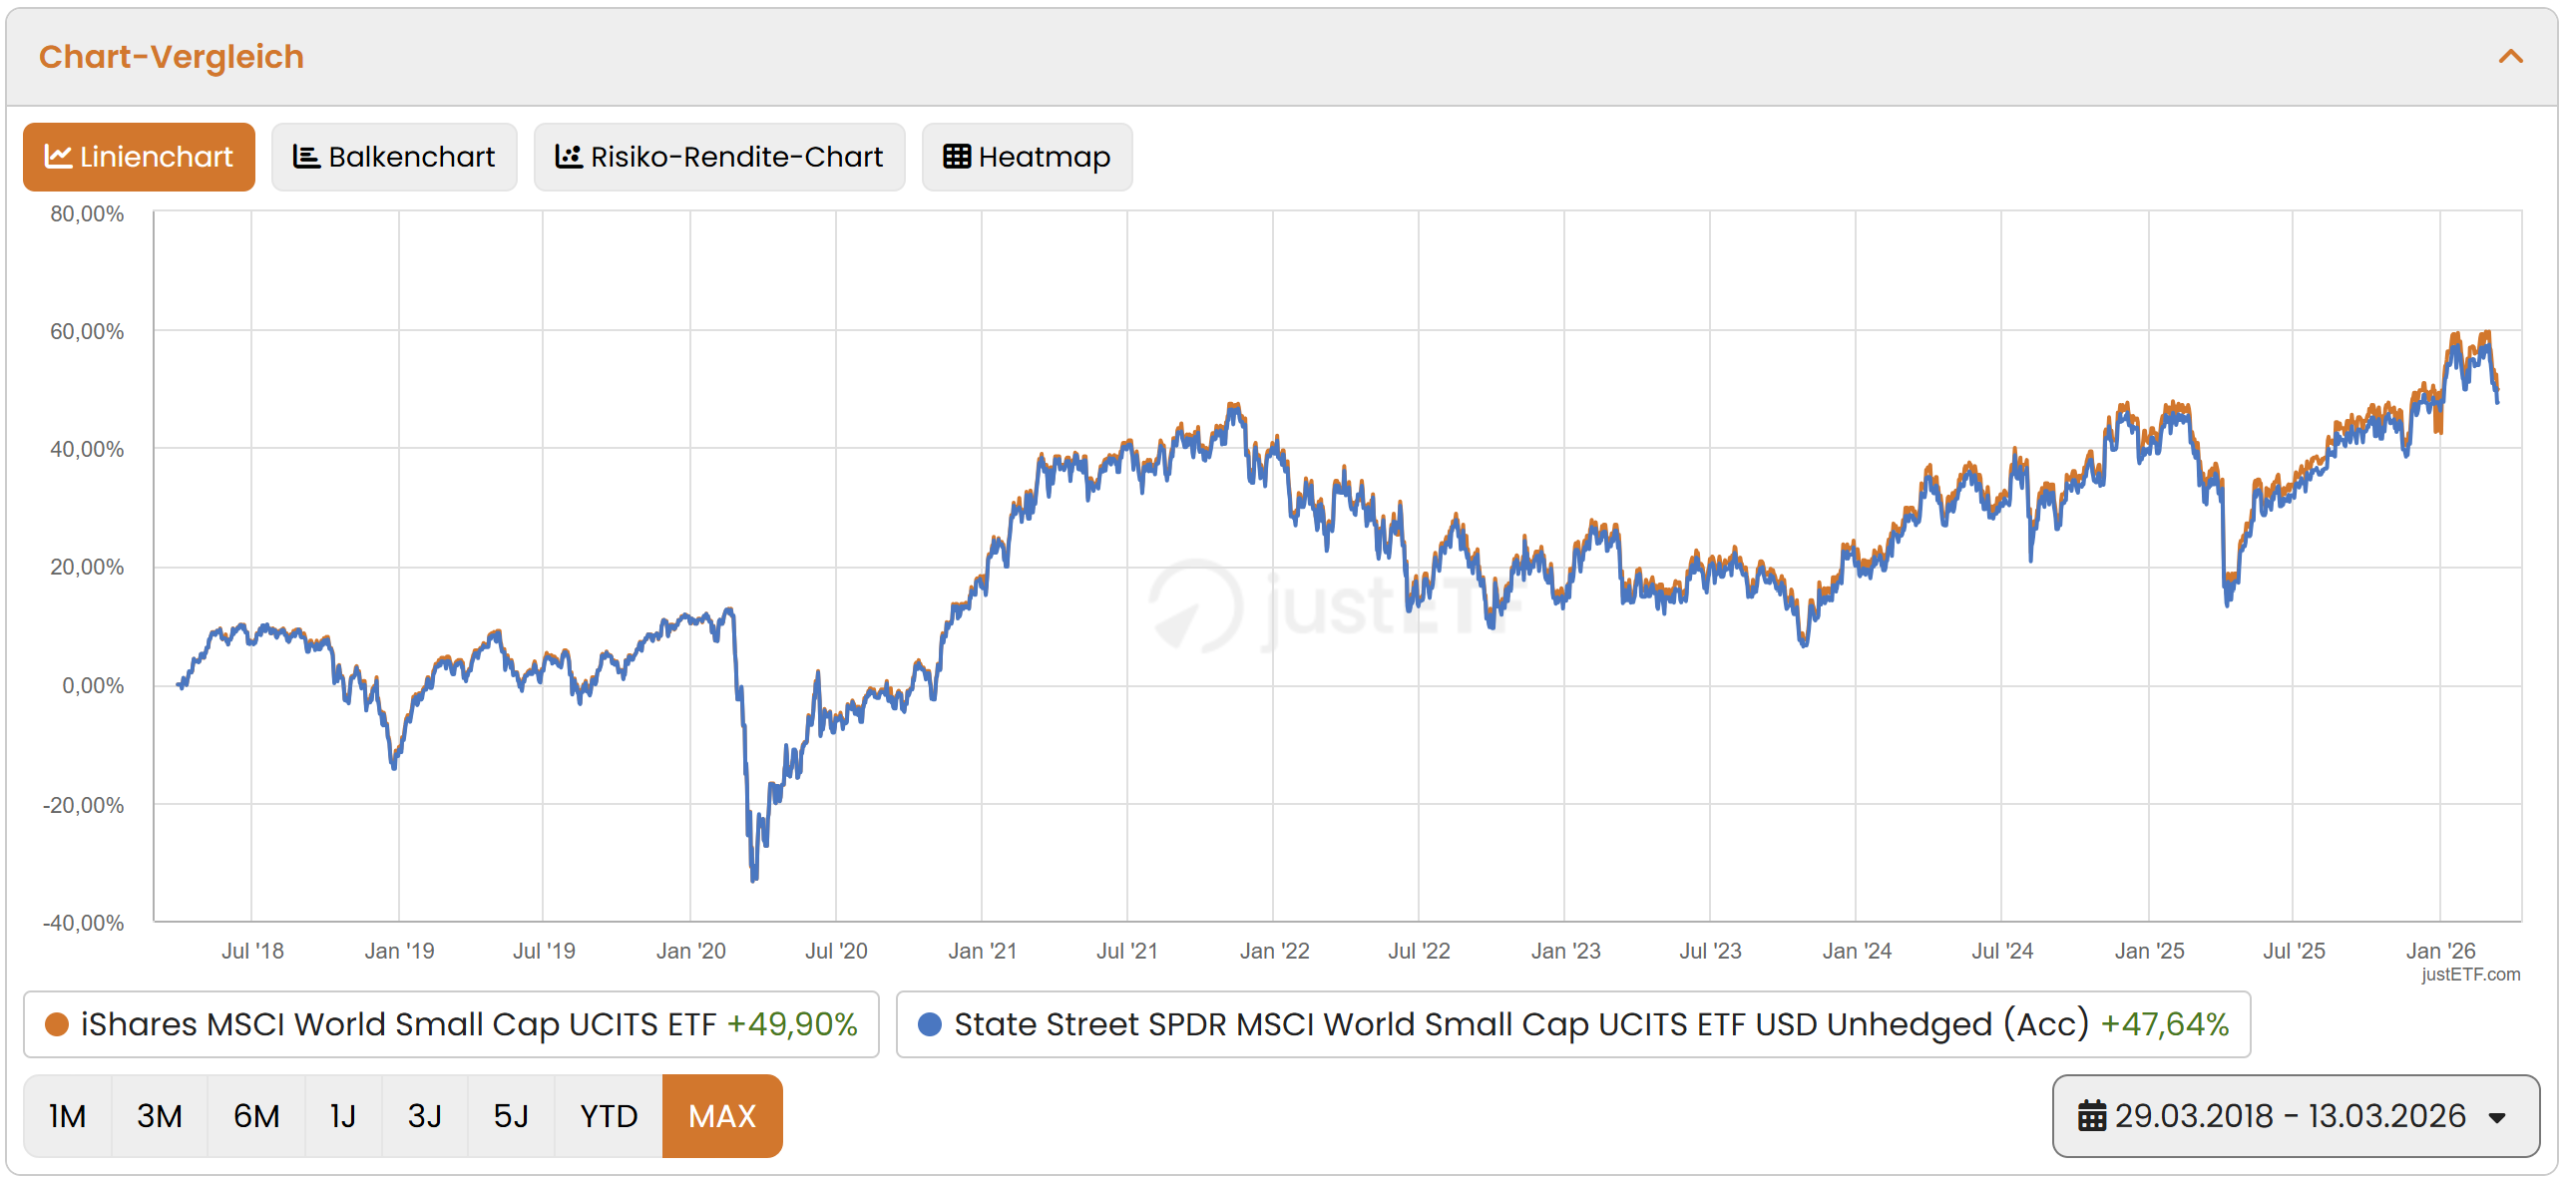
iShares MSCI World Small Cap UCITS ETF Acc | IE00BF4RFH31
State Street SPDR MSCI World Small Cap UCITS ETF USD Unhedged (Acc) | IE00BCBJG560
The iShares ETF was launched in March 2018, has a significantly higher fund volume of CHF 5,916 million and impresses with a lower TER of 0.35% p.a. compared to 0.45% for the State Street product. The iShares is also slightly ahead in terms of performance since March 2018 with +49.90% vs. +47.64%. The State Street ETF only scores with its longer market experience since November 2013. Transparency note: We are invested in the iShares product ourselves.
Performance comparison of both ETFs since 2018, incl. dividends and after costs. (Source: justETF)
Value premium
Value stocks in an academic context (and not stock-picking à la Warren Buffett) have a particularly low share price relative to their fundamentals. This undervaluation is usually determined on the basis of the price-to-book ratio (P/B ratio), the price-to-earnings ratio (P/E ratio), the dividend yield and the free cash flow.
The largest position in MSCI World Value as at February 27, 2026 is – quite surprisingly – the Google share Alphabet. Despite its growth character, the tech giant is considered a value stock due to its comparatively low price/earnings ratio (P/E ratio) compared to the rest of the industry.
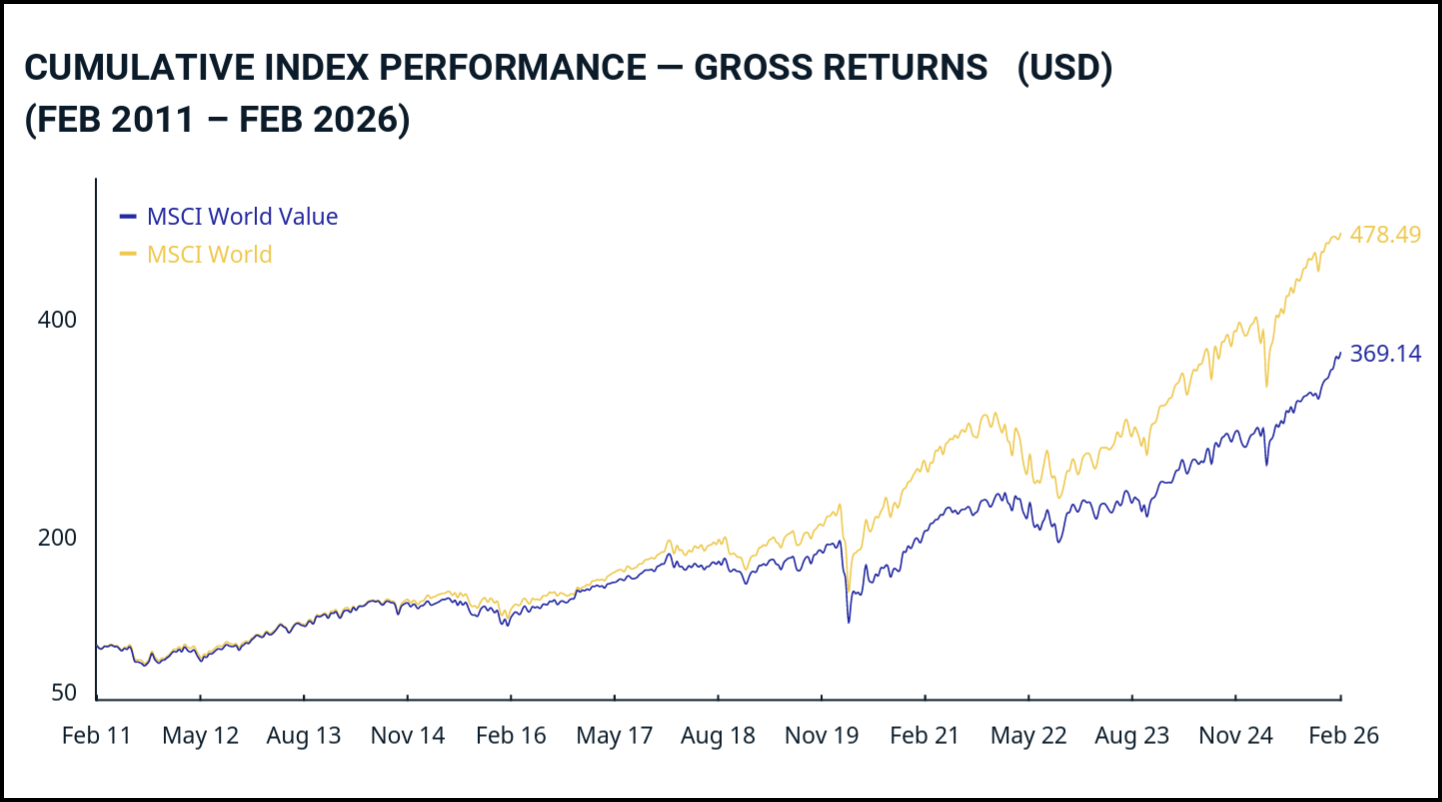
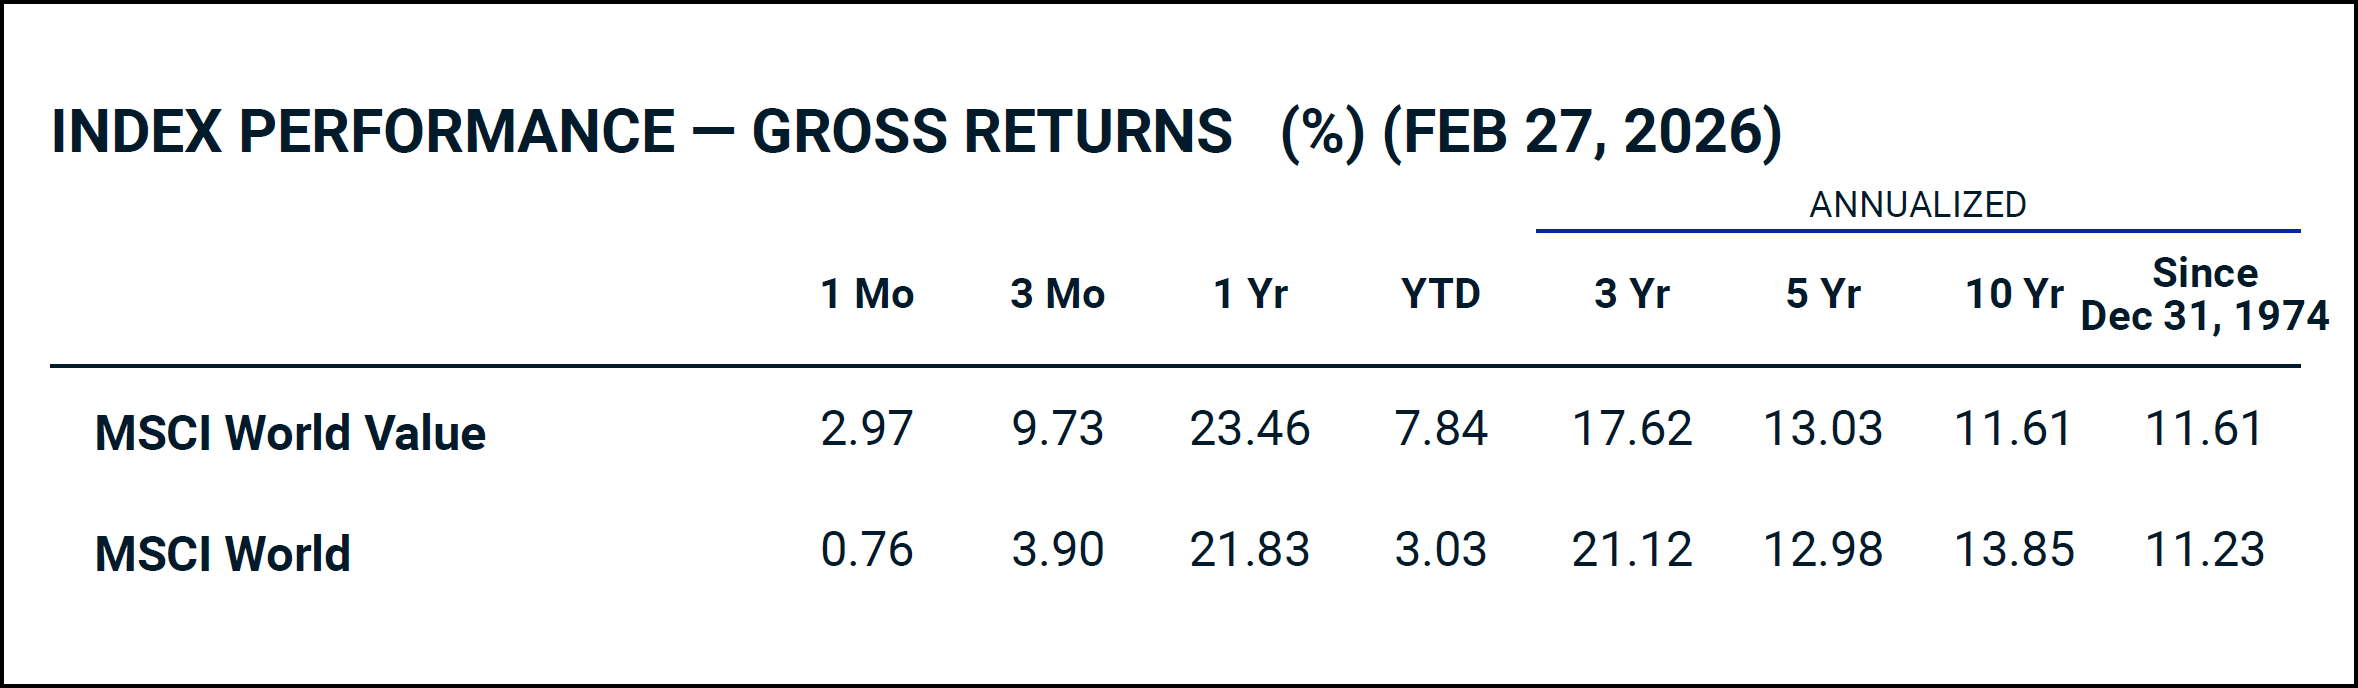
15-year index comparison between MSCI World Value and the market-neutral MSCI World. Value lags slightly behind the overall market. Gross return in USD, incl. dividends and before withholding tax deduction. (Source: MSCI) Annualized gross returns as at 27 February 2026. Since the index was launched (December 1974), MSCI World Value has barely outperformed the overall market by 0.38 percentage points per year. (Source: MSCI)
Is the value factor worth it?
The data paints a sobering picture: Over the last 15 years, the MSCI World Value has significantly underperformed the market-neutral MSCI World – driven by the dominance of US technology stocks. A long-term comparison since 1974 shows a marginal excess return of 0.38 percentage points (11.61% vs. 11.23%), but this is before costs and taxes. If the higher product costs and the additional tax burden from dividend distributions are deducted, the premium largely disappears – which is why we remain skeptical about the value factor.
How to invest in the value factor
If you still want to invest in the value factor, it is worth taking a look at the following two products:
Xtrackers MSCI World Value UCITS ETF 1C | IE00BL25JM42
iShares Edge MSCI World Value Factor UCITS ETF| IE00BP3QZB59
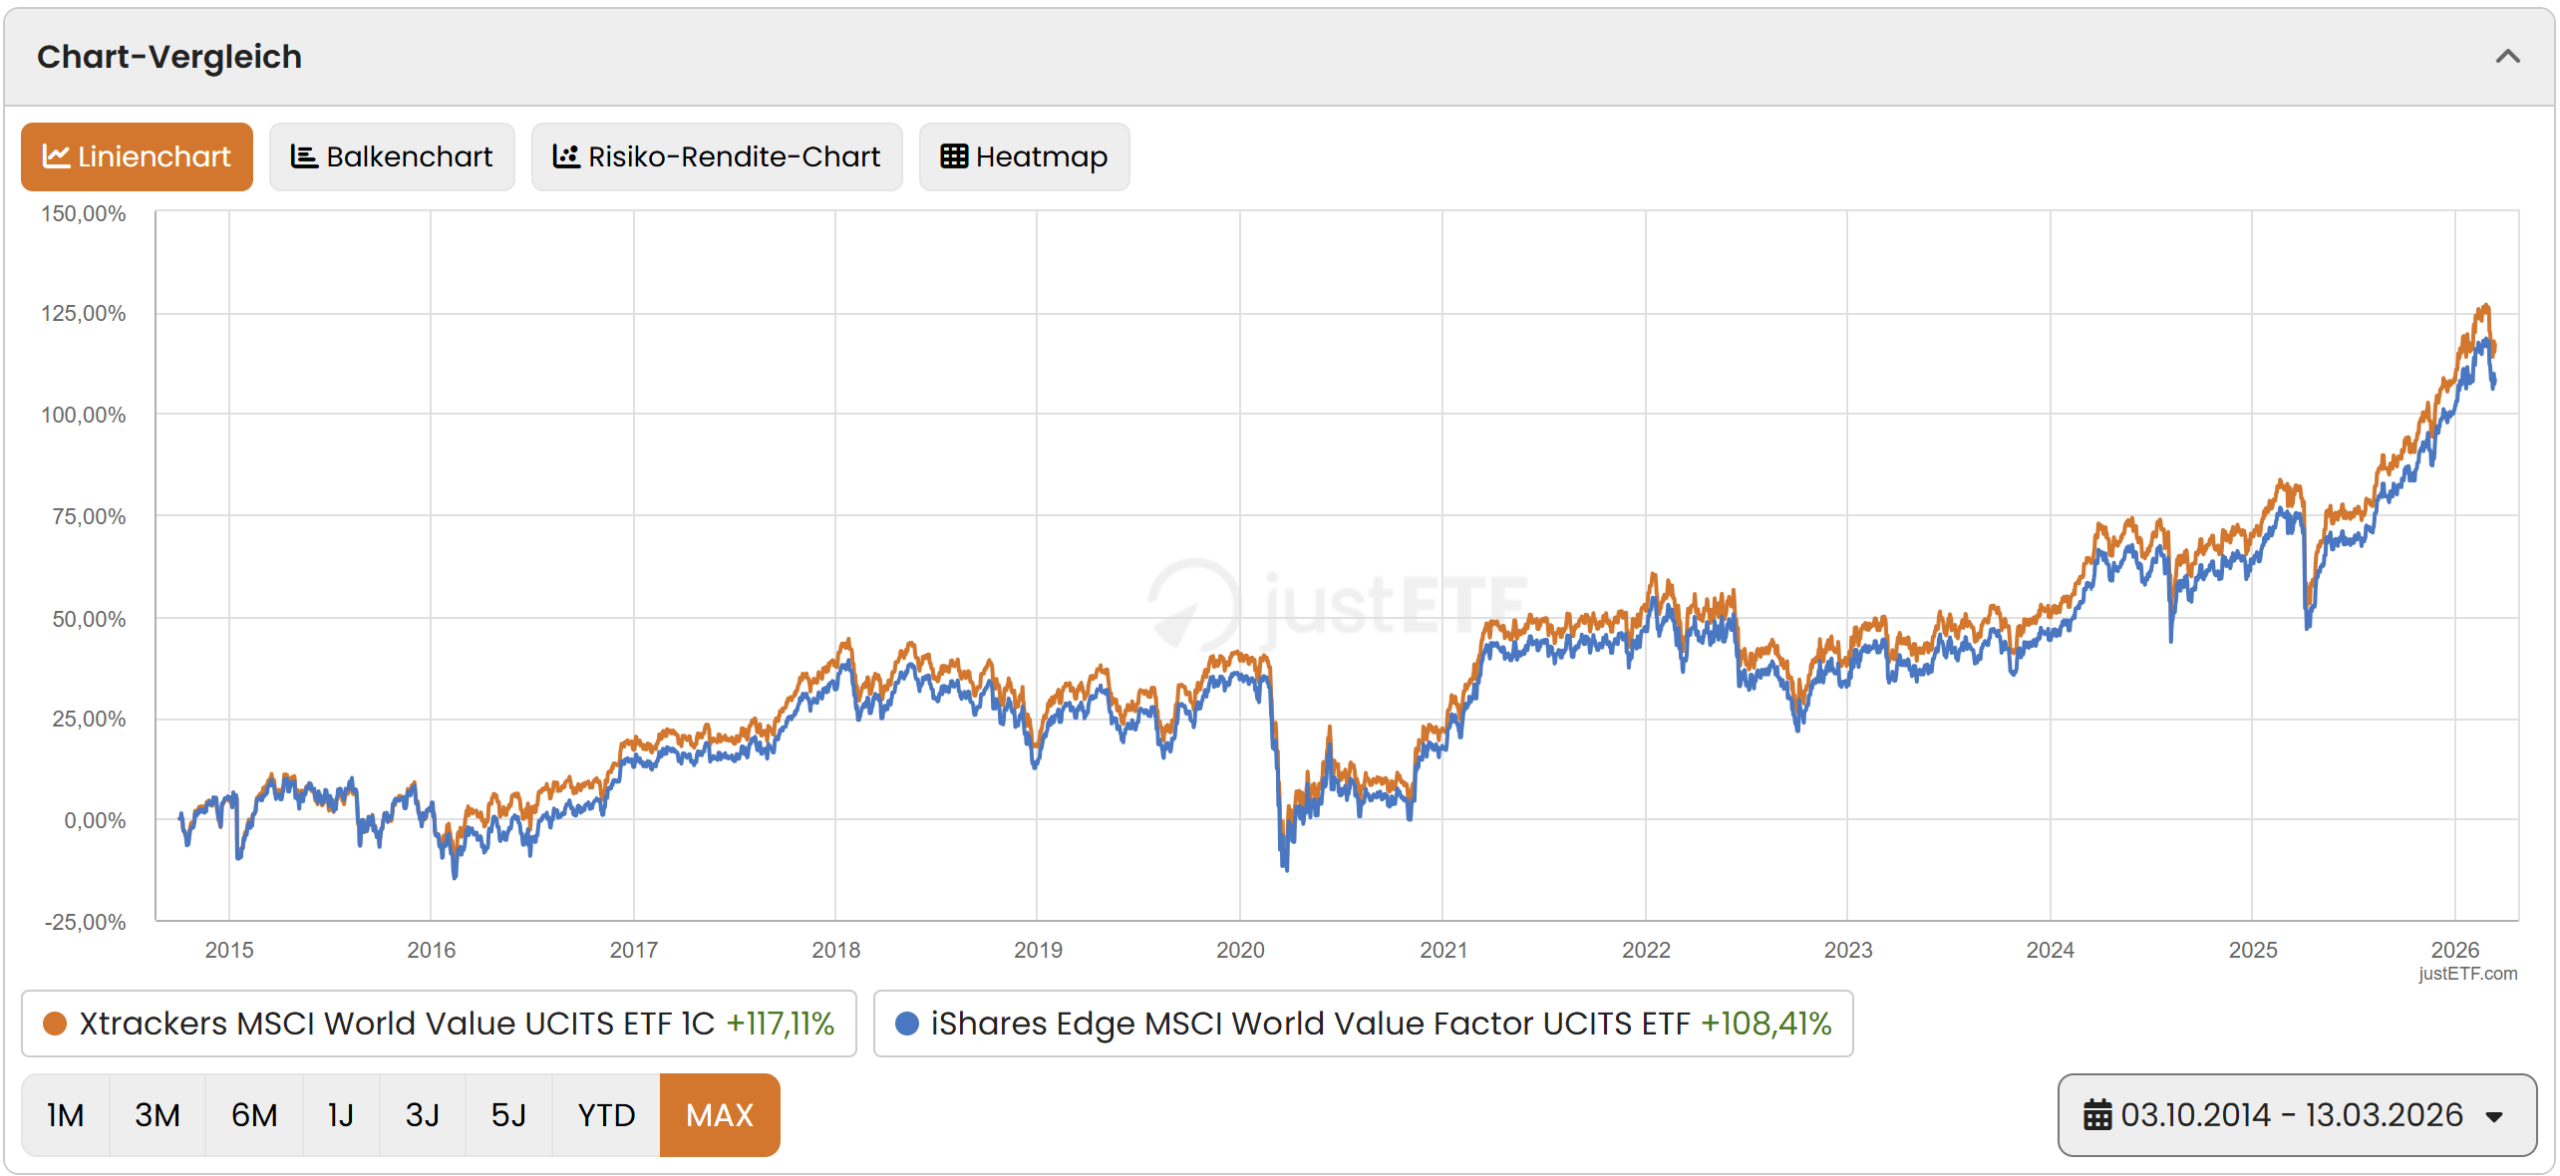
Both ETFs were launched in 2014 and impress with a fair TER of 0.25% p.a. Since its launch, the Xtrackers ETF has outperformed with +117% compared to +108% for the iShares product – albeit with a lower fund volume (CHF 3,381 million vs. CHF 4,508 million).
Performance comparison of both ETFs since inception, including dividends and after costs. (Source: justETF)
Momentum premium
Stocks that have outperformed the market in the past also show higher returns in the near future. In simple terms, this is the basic reasoning behind the momentum premium. It is therefore based on relative returns and includes shares that have outperformed the market in the last 6 and 12 months.
The largest position in the MSCI World Momentum as at 27.2.2026 is the Californian semiconductor and software company Broadcom.
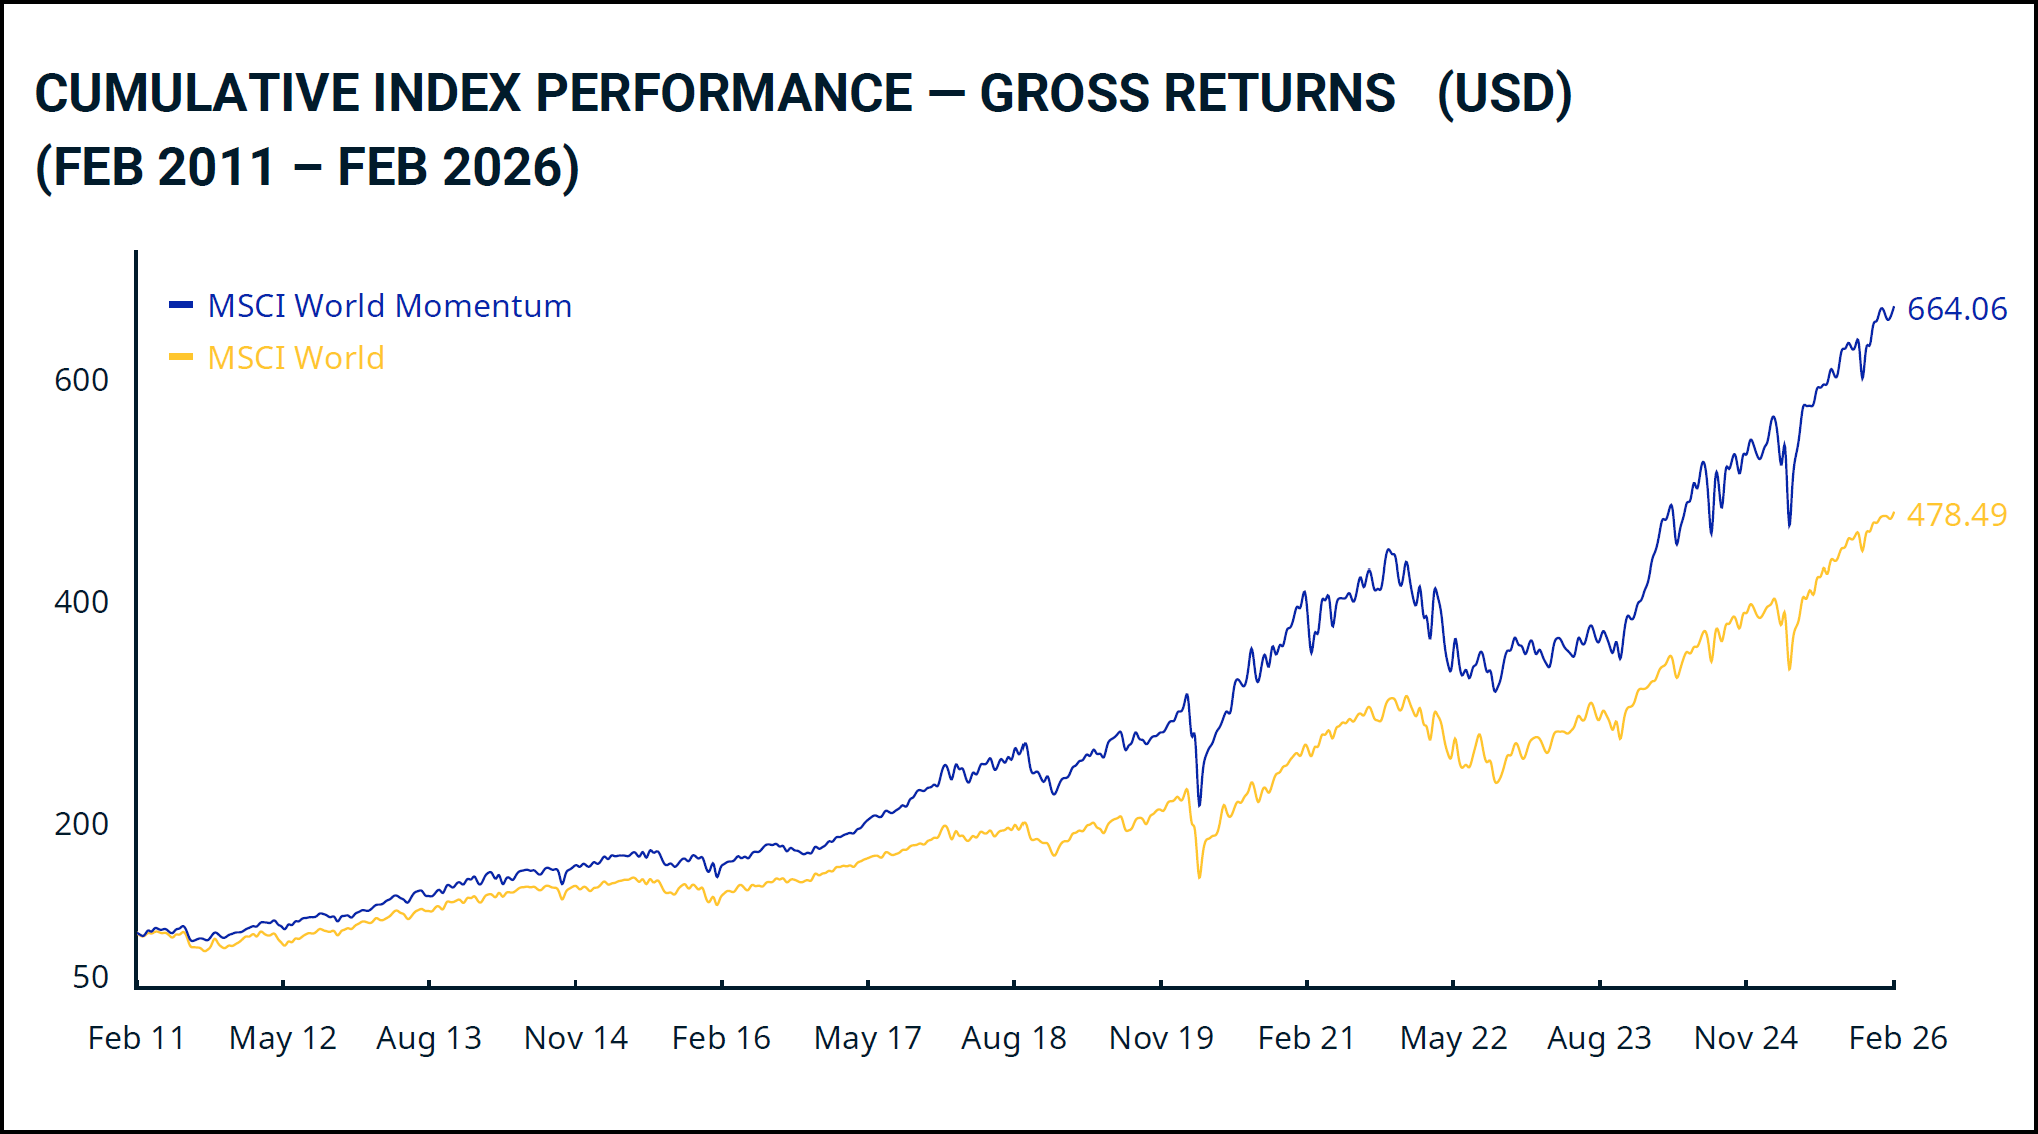
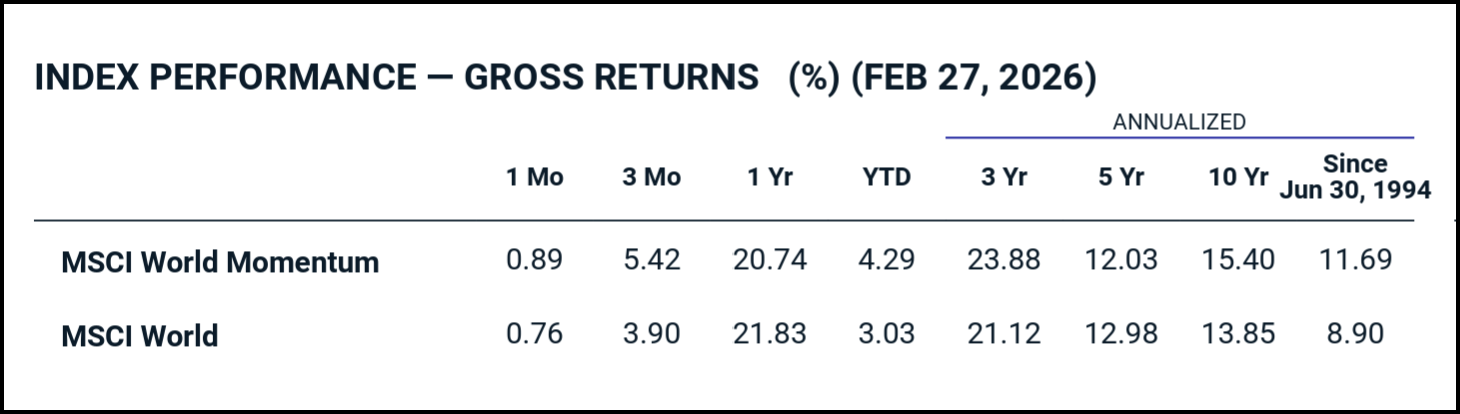
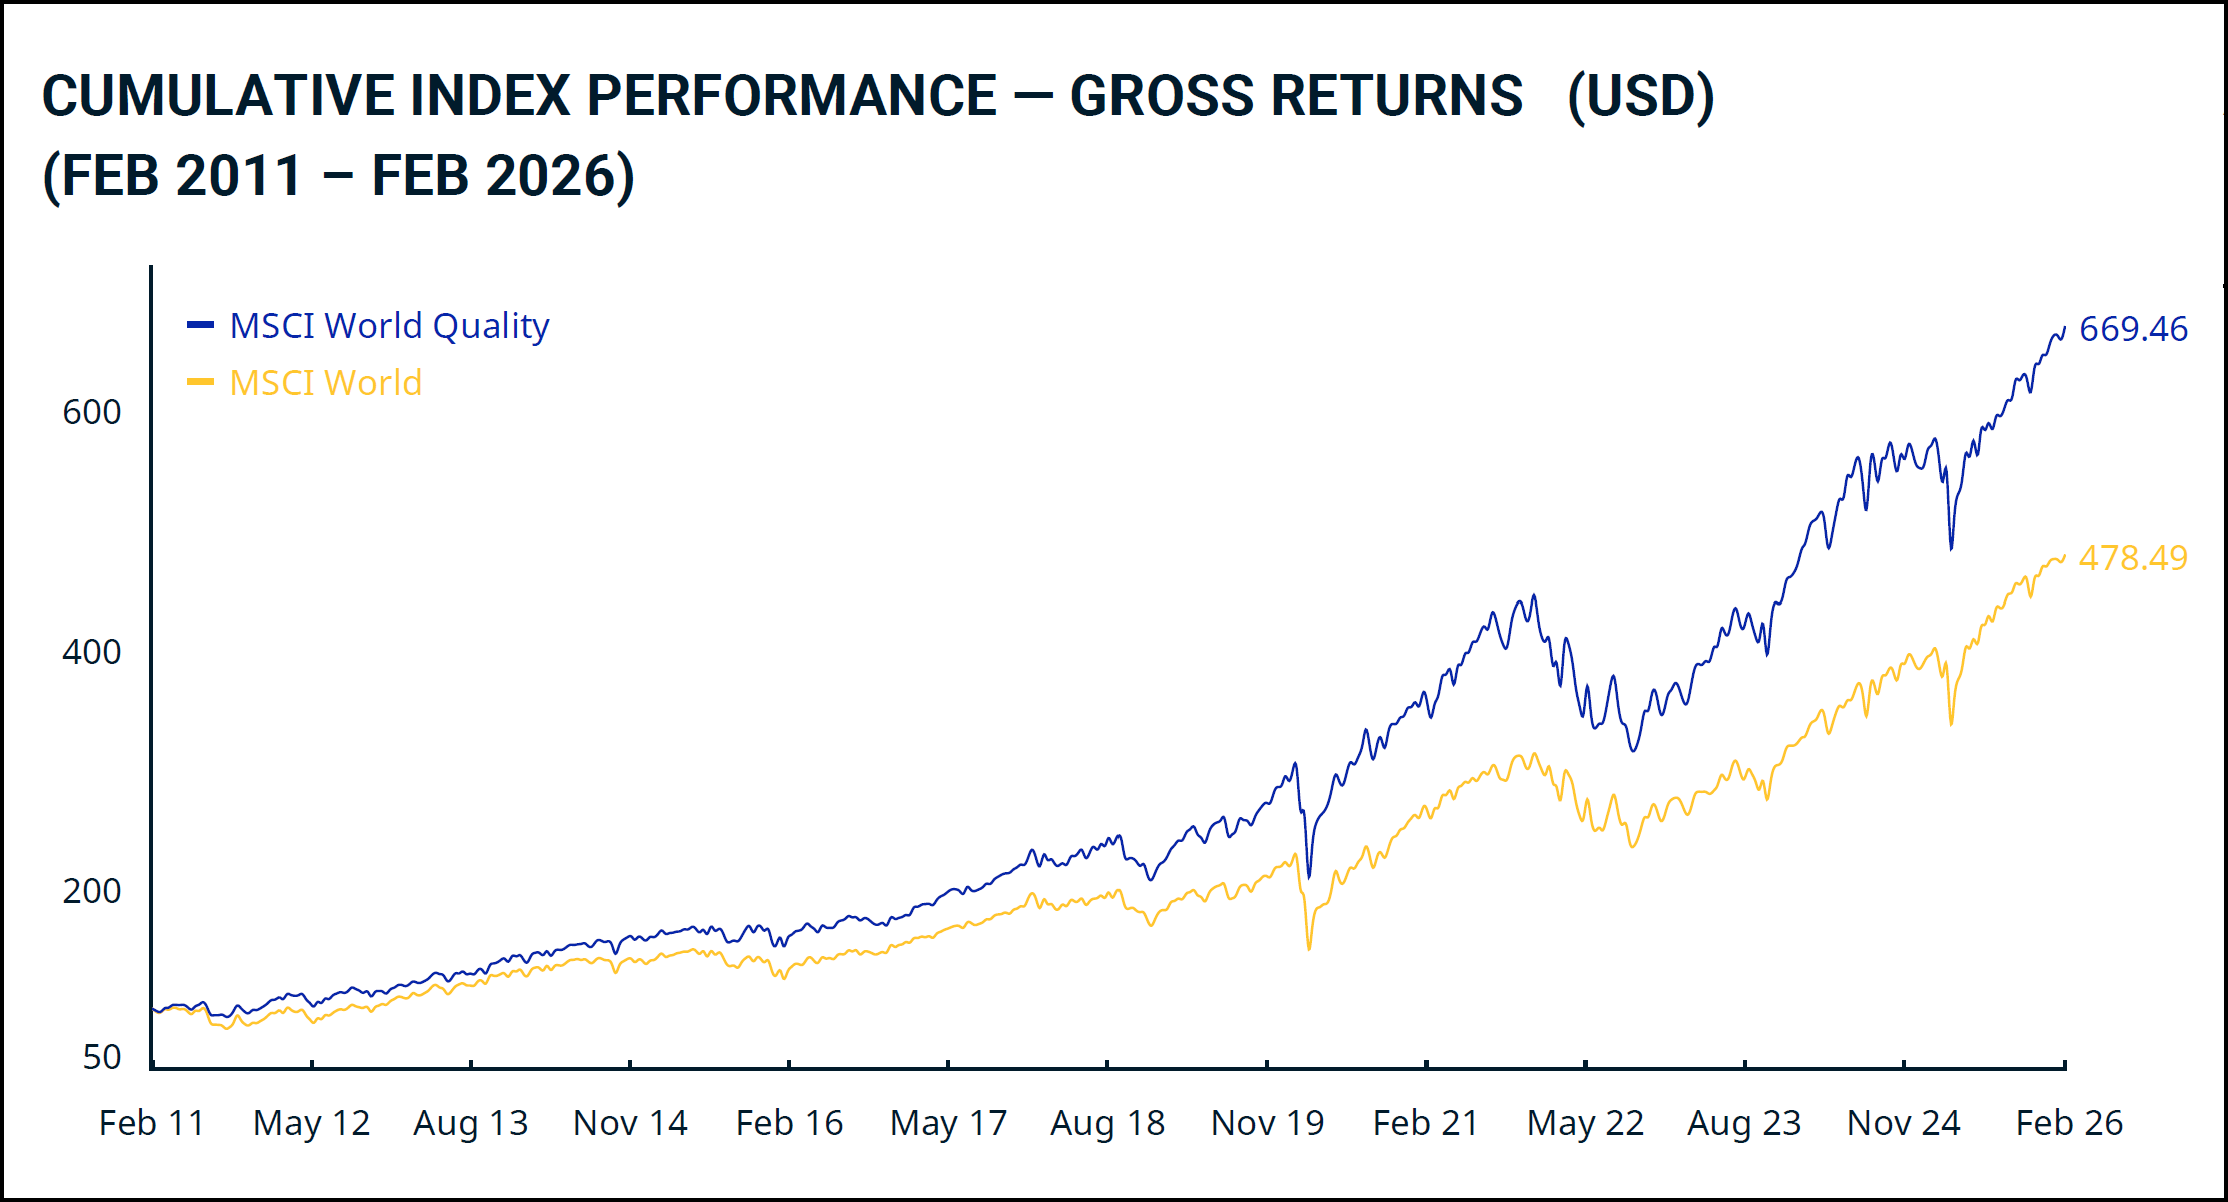
15-year index comparison between MSCI World Momentum and the market-neutral MSCI World. Momentum clearly outperforms the overall market. Gross return in USD, incl. dividends and before withholding tax deduction. Annualized gross returns as at 27 February 2026. Since the index was launched (June 1994), MSCI World Momentum has outperformed the overall market by a significant 2.79 percentage points per year. (Source: MSCI)
Is the momentum factor worth it?
The data speaks for itself: over the last 15 years, the MSCI World Momentum has clearly outperformed the market-neutral MSCI World with 664 vs. 478 points. In a long-term comparison since 1994, the momentum factor also impresses with an annualized return of 11.69% compared to 8.90% for the MSCI World – an excess return of 2.79 percentage points over around 32 years. This makes the momentum factor one of the best scientifically proven and most convincing factors in practice.
However, it should be noted that longer dry spells can also occur with the momentum factor. Although both indices lost a lot of value during the coronavirus crash in 2020, the momentum index lagged significantly behind the market as a whole in the subsequent recovery phase
How to invest in the momentum factor
The product selection for momentum ETFs is manageable – but the following two products are convincing in terms of their key data:
iShares Edge MSCI World Momentum Factor UCITS ETF Acc| IE00BP3QZ825
Xtrackers MSCI World Momentum UCITS ETF 1C| IE00BL25JP72
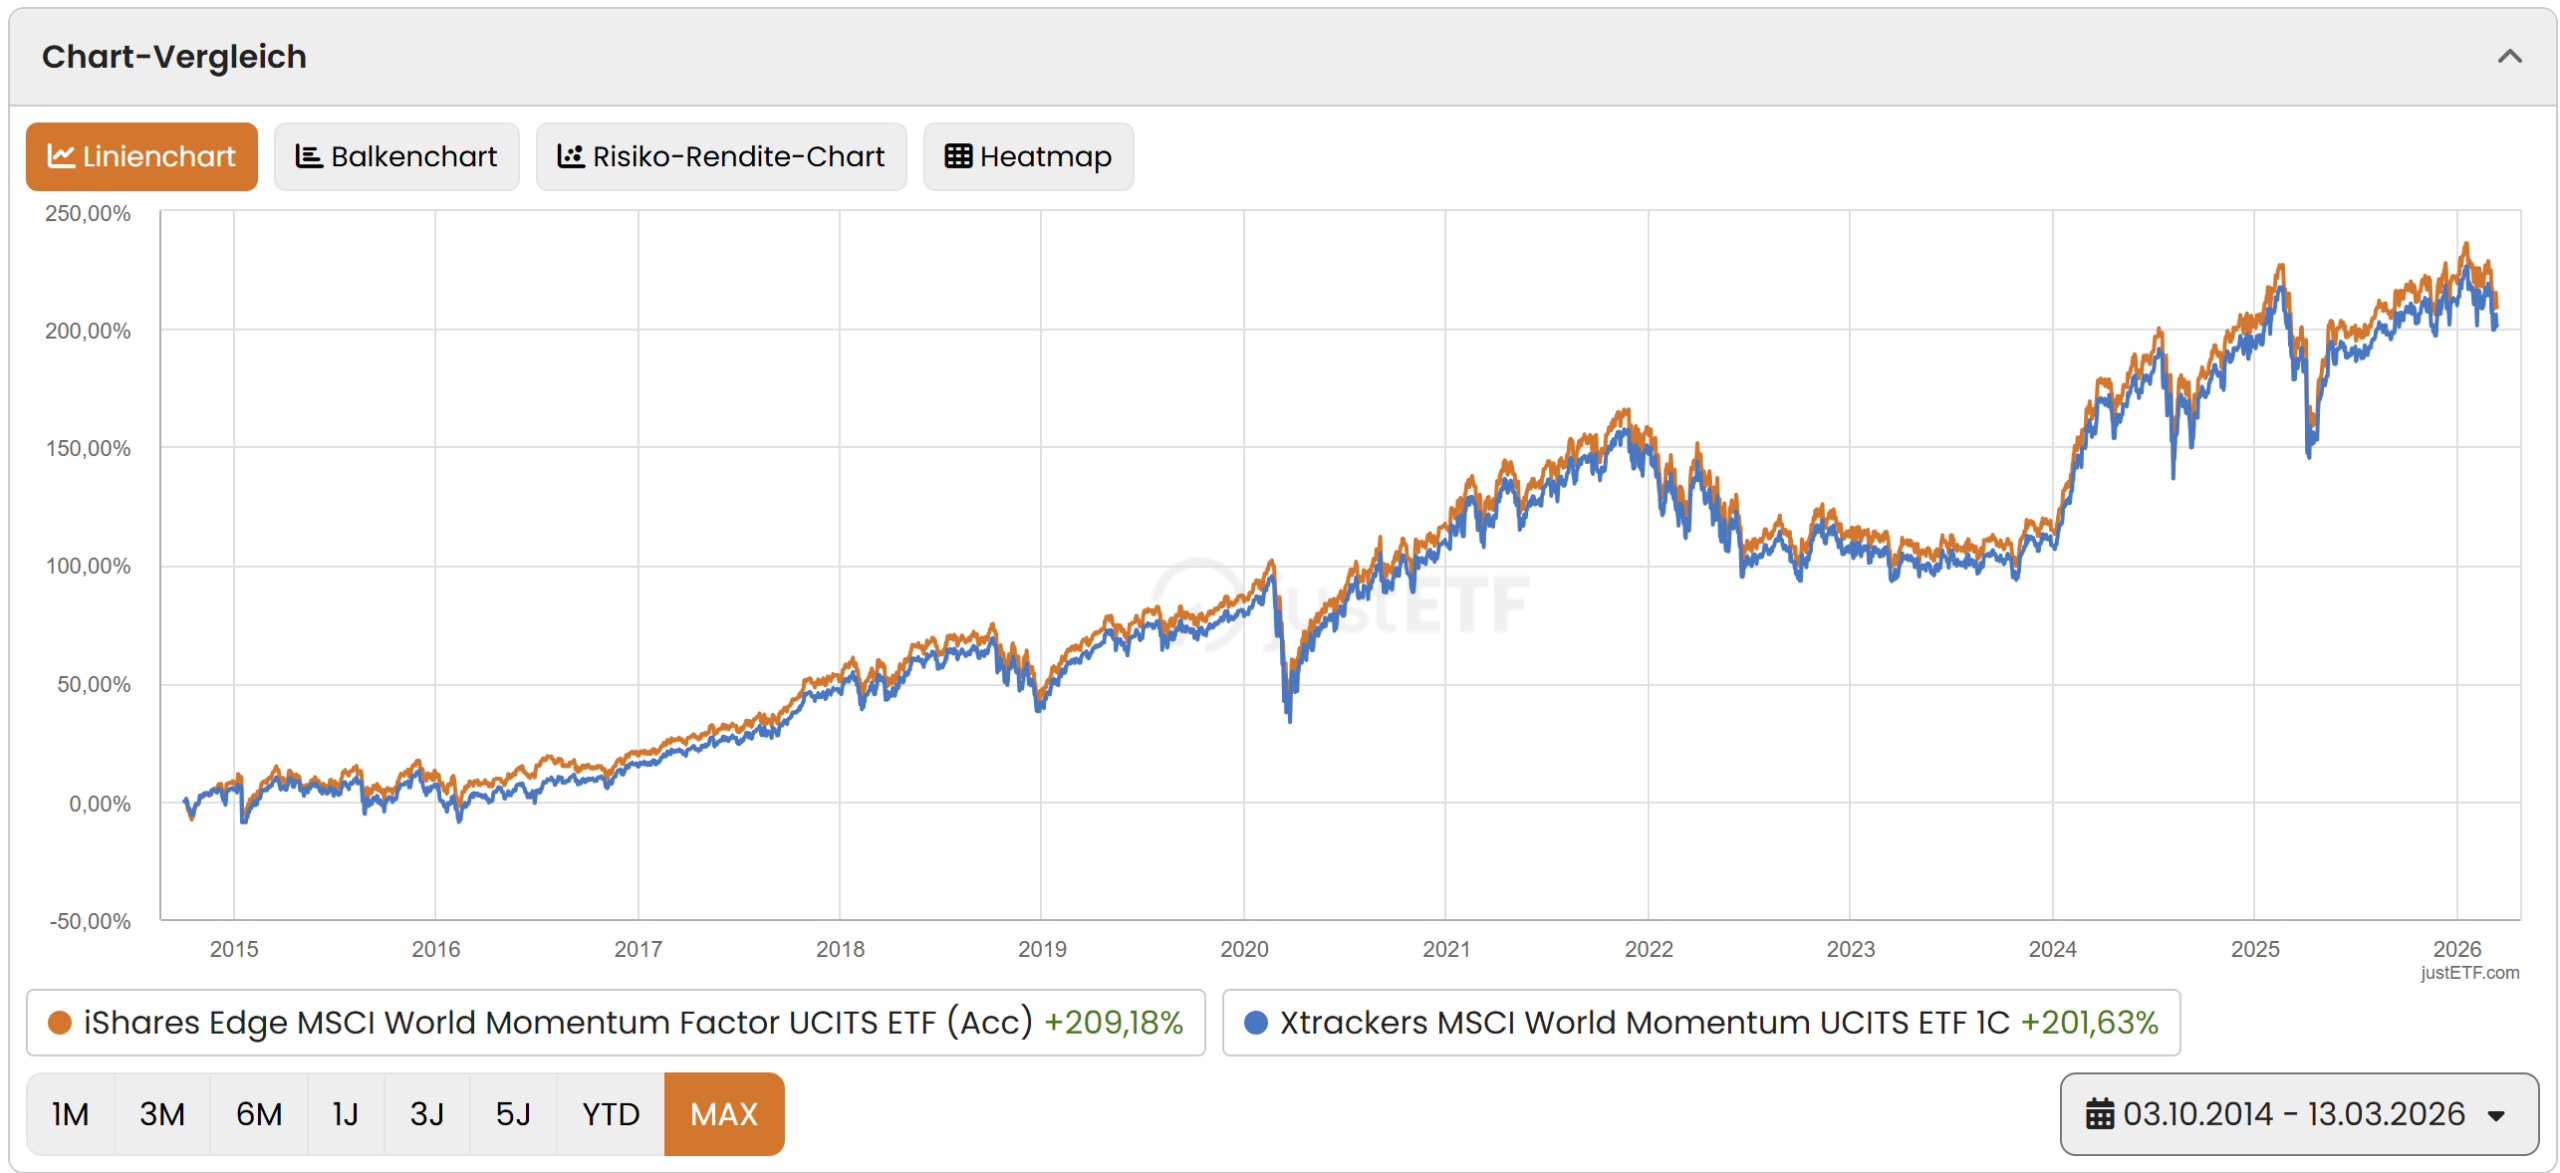
Both ETFs were launched in 2014 and impress with a fair TER of 0.25% p.a. Since its launch, the iShares ETF has performed slightly better at +209% compared to +202% for the Xtrackers product – with a significantly higher fund volume (CHF 3,070 million vs. CHF 1,432 million).
Performance comparison of both ETFs since inception, including dividends and after costs. (Source: justETF)
Quality premium
Quality stocks typically have three characteristics: a high return on equity (ROE), stable and predictable earnings and low debt. As there is no standardized scientific definition, the exact measurement varies depending on the provider – the MSCI World Quality Index, for example, is based on these three fundamental variables.
The investment factor from Fama and French’s 5-factor model is worth mentioning in this context: it describes the observation that companies with conservative investment behavior perform better in the long term than those that expand aggressively. As it is closely related to the quality factor in terms of content and there are hardly any independent ETF products, we do not treat it as a separate factor.
The largest position in MSCI World Quality as at 27.2.2026 is Meta – operator of Facebook, Instagram and WhatsApp.
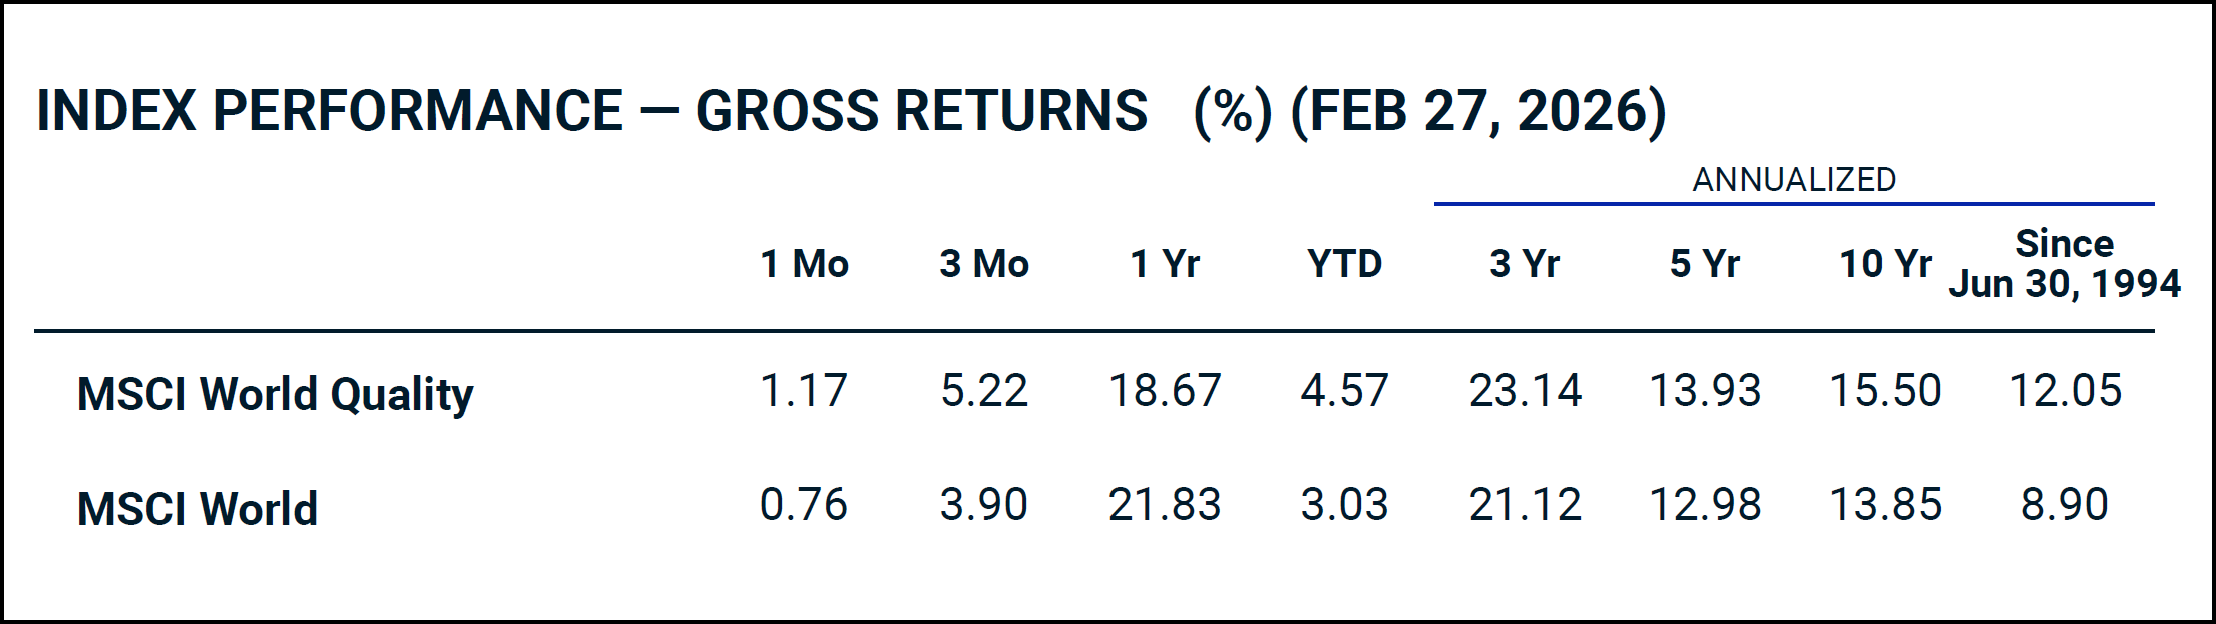
15-year index comparison between MSCI World Quality and the market-neutral MSCI World. Quality clearly outperforms the overall market. Gross return in USD, incl. dividends and before withholding tax deduction. (Source: MSCI) Annualized gross returns as at 27 February 2026. Since the index was launched (June 1994), MSCI World Quality has outperformed the overall market by a strong 3.15 percentage points per year. (Source: MSCI)
Is the quality factor worth it?
The quality factor offers one of the strongest long-term premiums in this comparison: since 1994, the MSCI World Quality has outperformed the overall market by 3.15 percentage points annually. It is particularly noteworthy that quality stocks tend to be more resilient than the broad market in times of crisis thanks to their solid balance sheets and stable earnings. The premium is well documented scientifically and is considered more robust than the value or size factor, for example.
How to invest in the quality factor
There are two convincing products to choose from for the quality factor:
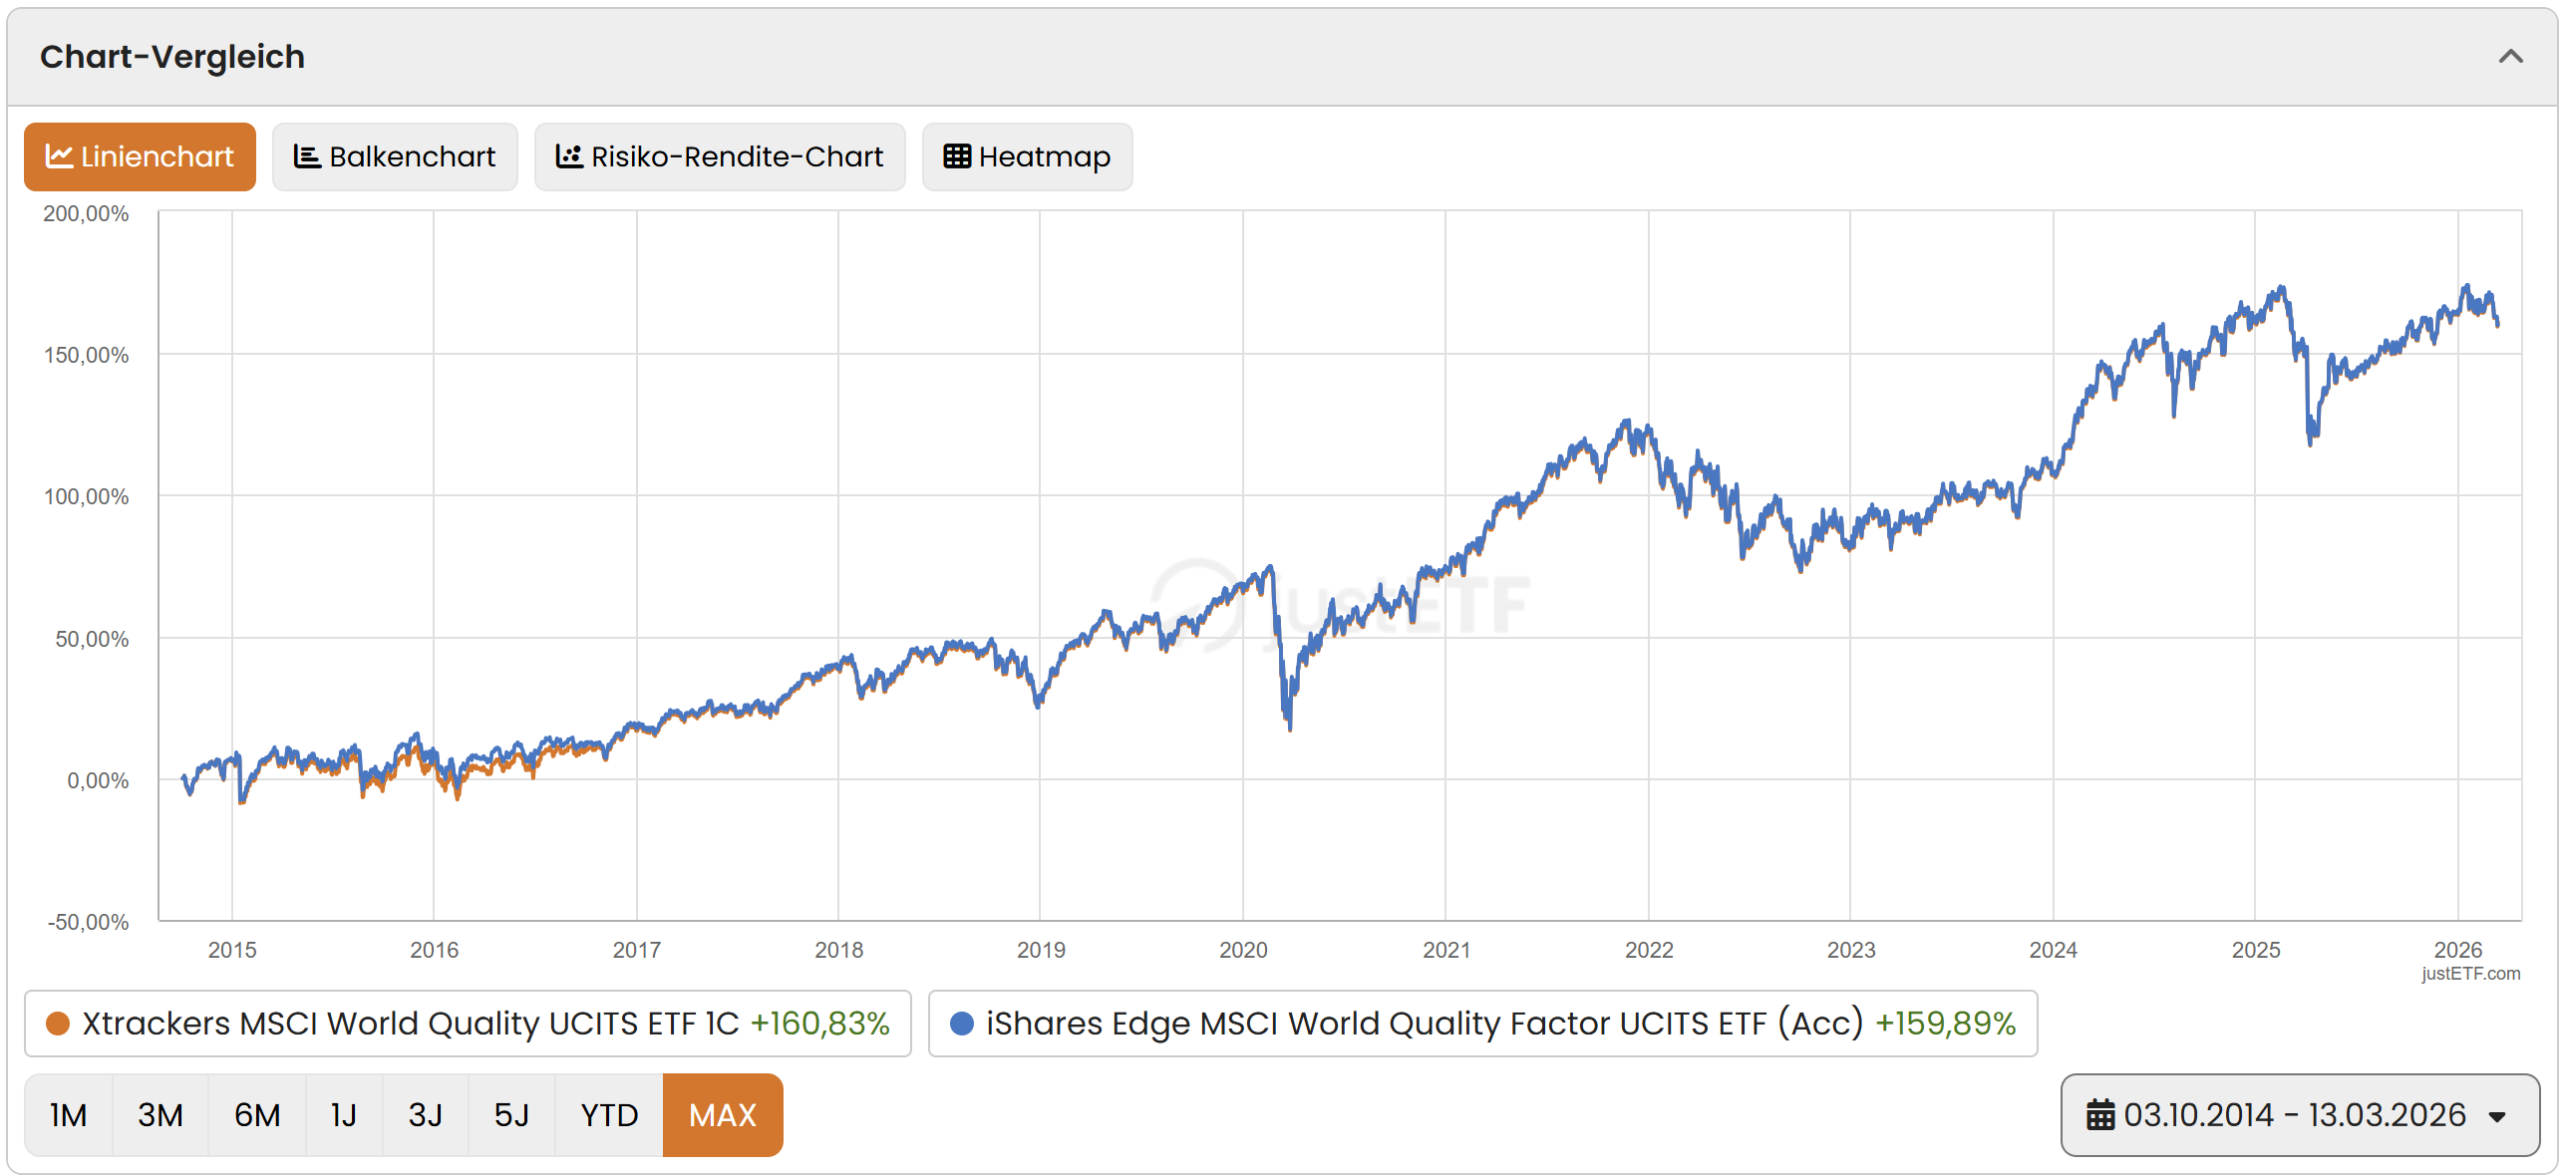
Xtrackers MSCI World Quality UCITS ETF 1C | IE00BL25JL35
Both ETFs were launched in October 2014 and impress with a fair TER of 0.25% p.a. Since its launch, the Xtrackers ETF has performed marginally better at +161% compared to +160% for the iShares product – the iShares product impresses with a significantly higher fund volume (CHF 3,587 million vs. CHF 2,109 million).
Performance comparison of both ETFs since inception, including dividends and after costs. (Source: justETF)
Political risk premium
This factor premium relates to equities from emerging markets or emerging countries. It is essentially explained by compensation for a higher risk resulting from political instability, corruption or an inadequate legal system or a lack of separation of powers, among other things.
In contrast to the previous factors – size, value, momentum and quality – political risk is not based on the fundamental data of the companies themselves. The selection is based solely on geographical origin: a company is considered relevant because it is based in an emerging country – regardless of its size, valuation or quality.
Whether emerging markets are considered a factor in their own right has not been conclusively clarified by academics – they do not appear in the well-known factor models of Fama and French. However, Gerd Kommer, author of the standard work “Souverän investieren mit ETFs”, treats the increased political risk of these markets as a risk premium in its own right – we agree with this classification.
The largest position in the MSCI Emerging Markets as at 27.2.2026 is the Asian chip giant Taiwan Semiconductor – a global corporation that is considered an emerging market stock by MSCI solely due to its domicile. Index competitor FTSE, on the other hand, already classifies Taiwan as a developed market.
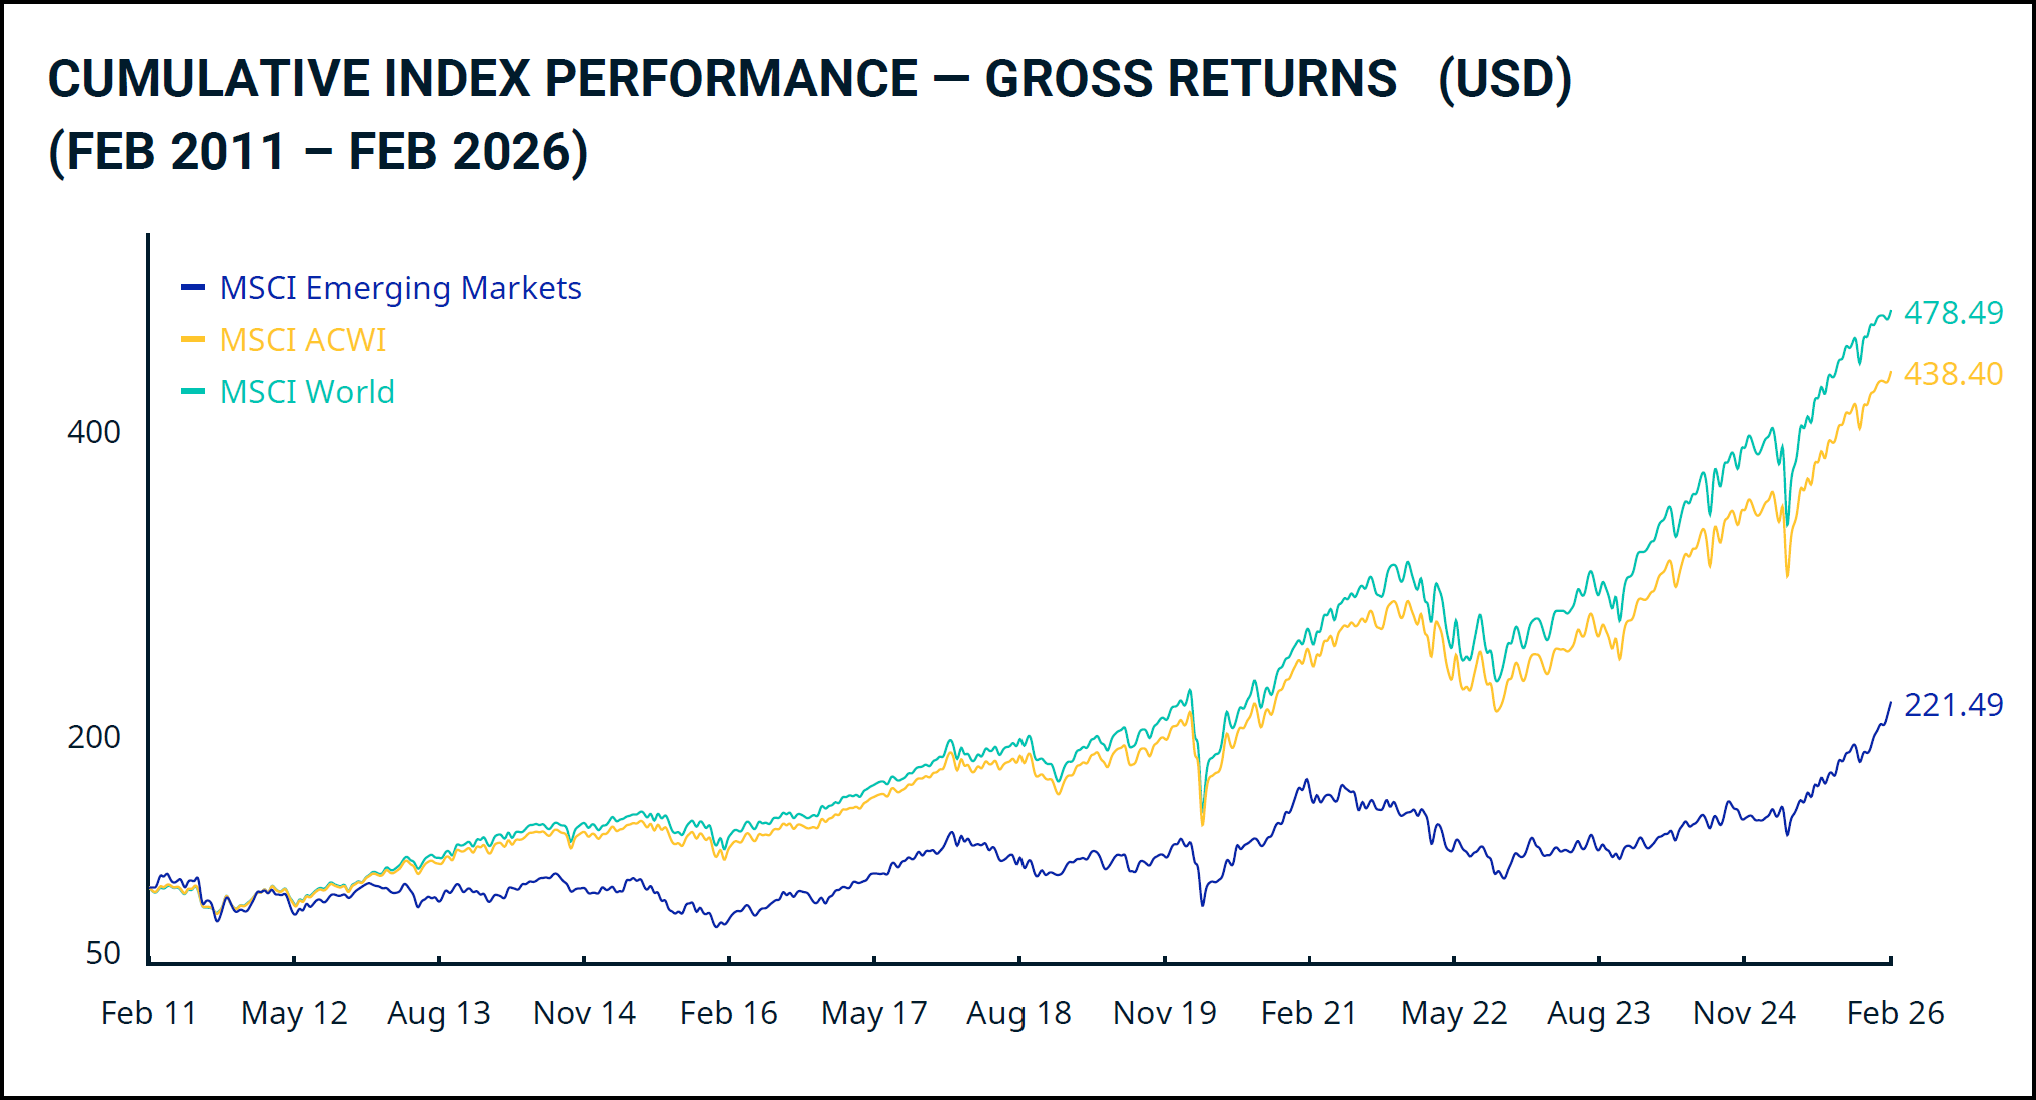
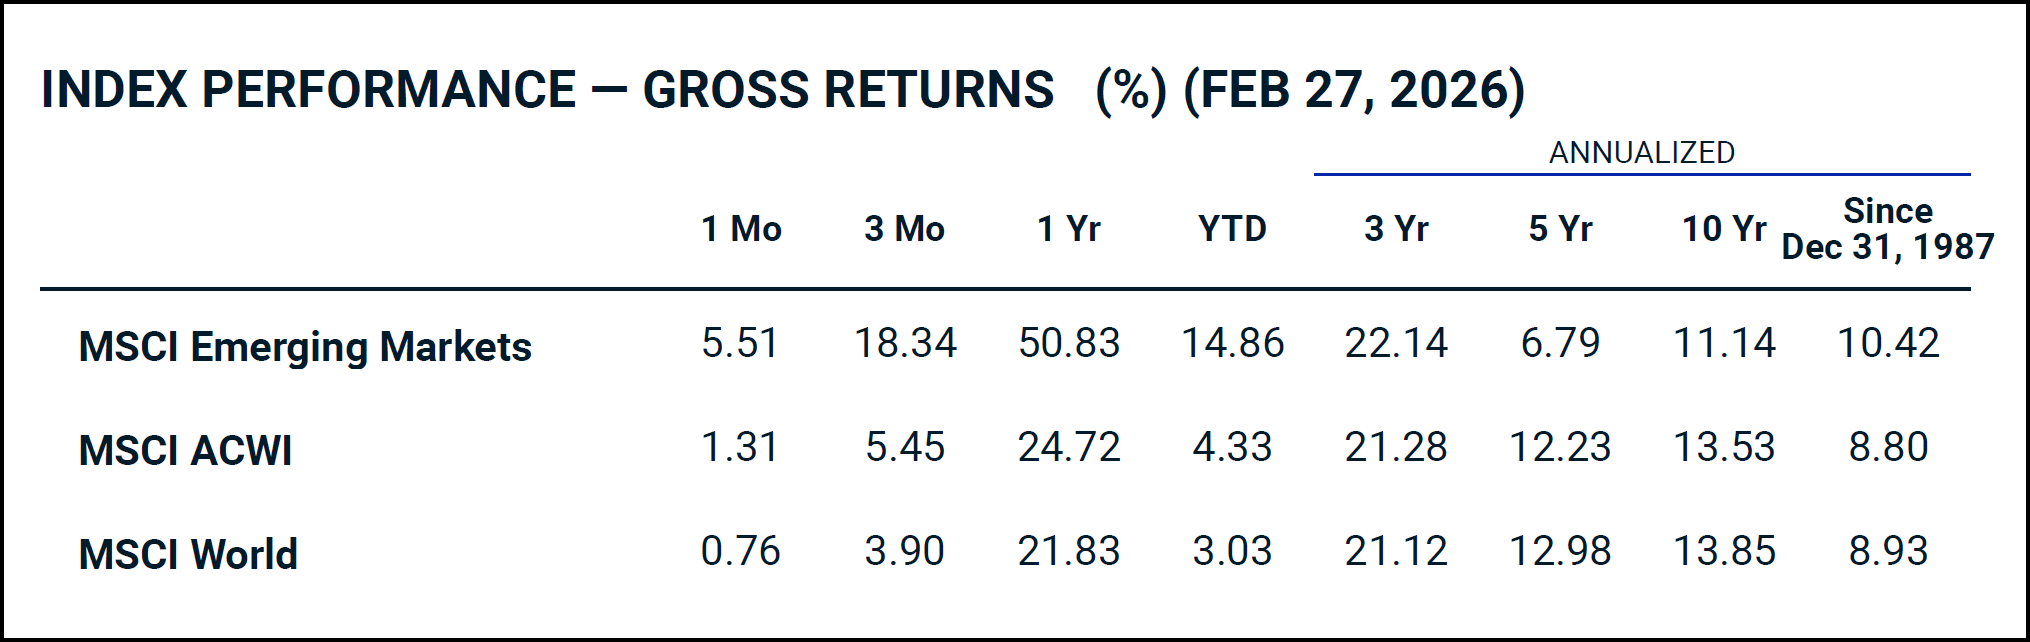
15-year index comparison between MSCI Emerging Markets, the global MSCI ACWI and the pure developed markets index MSCI World. Emerging Markets clearly lags behind both indices over this period. Gross return in USD, incl. dividends and before withholding tax deduction. (Source: MSCI) Annualized gross returns as of February 27, 2026. Since the inception of the index (December 1987), MSCI Emerging Markets has outperformed the global MSCI ACWI by 1.62 percentage points annually. (Source: MSCI)
Is the political risk factor worth it?
The political risk factor is convincing in the long term: since the launch of the MSCI Emerging Markets Index in December 1987, it has outperformed the global MSCI ACWI by 1.62 percentage points annually. So the premium exists – but it requires an extraordinary amount of patience.
This is because emerging markets tend to experience long and painful dry spells. The 15-year chart shows impressively that emerging market equities underperformed the developed markets almost continuously from 2011 to the end of 2024 – an underperformance of over a decade. Anyone who lost their nerve during this phase and exited the market missed out on the subsequent recovery. The annualized 5-year return of 6.79% compared to 12.23% for the MSCI ACWI underlines how persistent such phases can be.
Anyone aiming for a global portfolio by market capitalization should have around 10% invested in emerging markets anyway – this is simply the weighting that corresponds to the global equity market. If you also believe in the factor premium, you can deliberately overweight this proportion – but you should factor in the long dry spells and have a correspondingly long investment horizon.
The only, but significant advantage of factor investing is the excess return. This also applies – in the (very) long term and to varying degrees – to our five factors described above. The table below shows the excess return per factor and over different time periods.
Period
Number of Years
Size Premium
Value Premium
Momentum Premium
Quality Premium
Political Risk Premium
1975–2020
46
3,3%
0,4%
–
–
–
1975–1994
20
5,4%
2,1%
–
–
–
1995–2020
26
1,7%
-0,5%
4,3%
3,4%
0,6%
1975–1990
16
7,1%
2,1%
–
–
–
1991–2000
10
-3,1%
0,5%
–
–
2,3%
2001–2010
10
6,4%
1,4%
1,8%
-0,2%
15,4%
2011–2020
10
0,5%
-1,5%
4,0%
3,4%
-6,1%
Scientifically confirmed excess returns for five factors; all data before taxes and costs. (Source: Gerd Kommer, «Factor Investing – die Basics», updated November 2021)
The following interesting aspects stand out:
Size and value have so far been studied most thoroughly and over the longest periods of time – the data series go back to 1975. This is also confirmed by the MSCI data, which is available for Value up to December 1974.
The fluctuations are sometimes considerable. Between 2011 and 2020, for example, political risk stocks underperformed by 6.1%, whereas in the previous decade they outperformed by 15.4% annually. Our MSCI data confirms this picture: since December 1987, the long-term premium has amounted to 1.62 percentage points per year – bought with extreme patience.
At 4.3% over 26 years (1995-2020), the momentum premium remains the most attractive in this comparison. This is also confirmed by our MSCI data: Since June 1994, MSCI World Momentum has outperformed the overall market by 2.79 percentage points annually. On the other side of the spectrum, the value factor even slipped into negative territory in the updated table (-0.5% over 26 years) – a finding that is reflected in our MSCI data: Since 1974, the premium has been a scant 0.38 percentage points annually.
Quality impresses with a stable 3.4% over 26 years – a finding that is impressively confirmed by our MSCI data: Since June 1994, the MSCI World Quality has beaten the overall market by a strong 3.15 percentage points annually.
What are the disadvantages of factor investing?
But before you decide on factor investing, you should also be aware of the main disadvantages.
All five factors analyzed have the following disadvantages:
Higher costs (TER), even if prices have fallen sharply in recent years and most factor ETFs have now settled at 0.25-0.35% p.a.
Small product range – the selection of ETFs is still limited, especially for the momentum factor
Longer stretches of negative returns than with a market-neutral investment require a greater degree of suffering and stamina – as the Kommer table impressively shows, individual factors can be negative over an entire decade
The following aspects also have a negative impact on the value factor
No significant outperformance in the last three decades – our MSCI data confirms: since 1974, the long-term premium has amounted to a mere 0.38 percentage points per year – effectively zero after costs
Above-average tax burden for Swiss investors, as the distributive share of total performance is higher for value stocks than for the overall market and the other four factors (see article Dividend strategy is not worthwhile!).
Where can I buy factor ETFs?
The factor ETFs presented here are available from most established online brokers. You are in particularly good hands with the following four, which we have tested in detail and recommend:
Note: Saxo is particularly attractive for iShares ETFs: selected iShares products can be purchased free of charge via the ETF savings plans – including, for example, the iShares Edge MSCI World Quality Factor ETF. This is a clear advantage for anyone who wants to invest in factor premiums automatically and cost-efficiently.
– Partner offer –
– – – – –
On our compact recommendation page you will find the most important information about our favorite online brokers, including a starting bonus.
Conclusion
We summarize our conclusions in the following five points:
Factor investing can lead to an excess return in the long term and is generally worth considering – but is not a must. Anyone who decides to do so should only use factor ETFs as an addition to their core portfolio, not as a complete replacement for a broad market ETF. An investment in the overall market remains a simpler and cheaper alternative anyway.
Momentum and quality stand out as by far the most attractive factors: since 1994, both have outperformed the overall market by around 3 percentage points annually. Political risk and small size are also positive, but the premiums are more modest. The value factor is disappointing: after more than 50 years of research, the long-term premium after costs and taxes is effectively zero – so there can hardly be any talk of a noticeable premium.
The range of factor ETFs has improved in recent years and costs have fallen. Nevertheless, factor ETFs are still more expensive than market-neutral ETFs – an aspect that you should consider when making your decision.
The excess returns for the five factors examined have been scientifically confirmed over long periods of time. However, there is no guarantee that this will also apply in the future – most factor premiums have tended to weaken following their scientific discovery.
Factor investing requires iron discipline: individual factors can be negative for an entire decade. Anyone who cannot withstand these lean periods is better off with a simple global market ETF.
2026-03-18: Text and charts comprehensively updated.
Disclaimer
Disclaimer: Investing involves risks of loss. You must decide for yourself whether you want to bear these risks or not.
Errors excepted: We have written this article to the best of our knowledge and belief. Our aim is to provide you as a private investor with the most objective and meaningful financial information possible. However, should we have made any errors, forgotten important aspects and/or no longer have up-to-date information, we would be grateful if you could let us know.