
 Newsletter
The overall market beats most active fund managers. But is there a passive strategy that can outperform the overall market in the long run? That is exactly what factor investing promises. We present the five best-documented factor premiums and show which ones really deliver – and which ones disappoint in a long-term comparison.

In a nutshell
- Factor investing is a scientifically backed method of earning a higher long-term return than the overall market – but it is not a must, and if you use it, then only as an addition to your core portfolio.
- Momentum and Quality impress with the strongest premiums: around 3 percentage points a year since 1994.
- The Value factor disappoints: after costs and taxes, there is hardly any noticeable premium left.
- Factor investing requires a long investment horizon and iron discipline – individual factors can be negative for an entire decade.
- A simple global market ETF remains the cheaper and less stressful alternative.
Contents
- What is factor investing?
- When is something a factor premium?
- The most important factor premiums for equities
- How do the five factors perform?
- What are the disadvantages of factor investing?
- Where can you buy factor ETFs?
- Conclusion
- You might also be interested in
- Updates
- Disclaimer
What is factor investing?
Factor-based investing, smart beta investing or simply factor investing is an investment strategy that focuses on securities with certain characteristics – so-called factors. Numerous scientific studies, often covering periods of several decades, show that these factors have led to higher returns in the past. Factor-based investing therefore means deliberately overweighting factor premiums in a portfolio compared with a market-cap weighting. A market-cap weighting reflects the overall market according to market capitalisation and is the classic among passive investment strategies.
Factor investing is less suited as a complete replacement for a market-cap-weighted global portfolio and more as a targeted addition – in the sense of a core-satellite approach: the core of the portfolio remains a broadly diversified equity portfolio, while factor ETFs are added as satellites. A portfolio made up only of factors carries too much risk: past excess returns are no guarantee for the future, individual factors can be negative for an entire decade, and the stress that comes with it should not be underestimated.
Finance author Larry Swedroe and other experts have identified the following seven criteria:
- Confirmation by at least several dozen independent researchers
- High persistence, i.e. over several decades (the more evenly the factor premium is distributed, the more convincing it is)
- Global evidence, i.e. not limited to certain countries or sectors
- Clear filter criterion, i.e. no adjustments to the definition of the factor premium
- Cost-efficient implementation, i.e. a factor premium should remain even after costs
- Plausibility, i.e. there is a logical and convincing explanation behind it
- Uniqueness of the factor premium, i.e. not merely a variation of an existing factor premium
In his standard work “Souverän investieren mit Indexfonds und ETFs”, Gerd Kommer also mentions the following characteristics of factor premiums:
- Factor premiums can fluctuate strongly and cannot be reliably predicted in the short and medium term.
- Factor premiums are not “additive”: it is therefore not possible to simply add up the individual factor premiums in a multi-factor portfolio.
- Most factor premiums weaken after their scientific discovery, but often remain high enough to produce an excess return after costs.
- Factor investing costs more than comparable plain ETFs.
- Factor investing only works statistically, i.e. according to the law of large numbers – not at the level of individual stocks.
- Factor investing is compatible with the efficient market hypothesis (EMH).
- Factor investing can be described as a “more active” variant of “passive” investing. The main features such as cost minimisation, buy-and-hold, a strictly scientific approach and mechanical, rules-based implementation still apply.
Below we present five well-documented factor premiums in the “equities” asset class:
- Size factor: Small companies beat large ones
- Value factor: Cheaply valued stocks beat expensive ones
- Momentum factor: Past winners stay winners
- Quality factor: High-quality companies beat the market
- Political risk factor: Emerging markets as a separate risk premium
To illustrate each one, we compare the relevant MSCI factor index with a suitable benchmark index and show the long-term excess return since launch. Another factor – the investment factor from Fama and French’s five-factor model – is briefly explained under the Quality factor, but is not covered separately due to a lack of suitable ETF products.
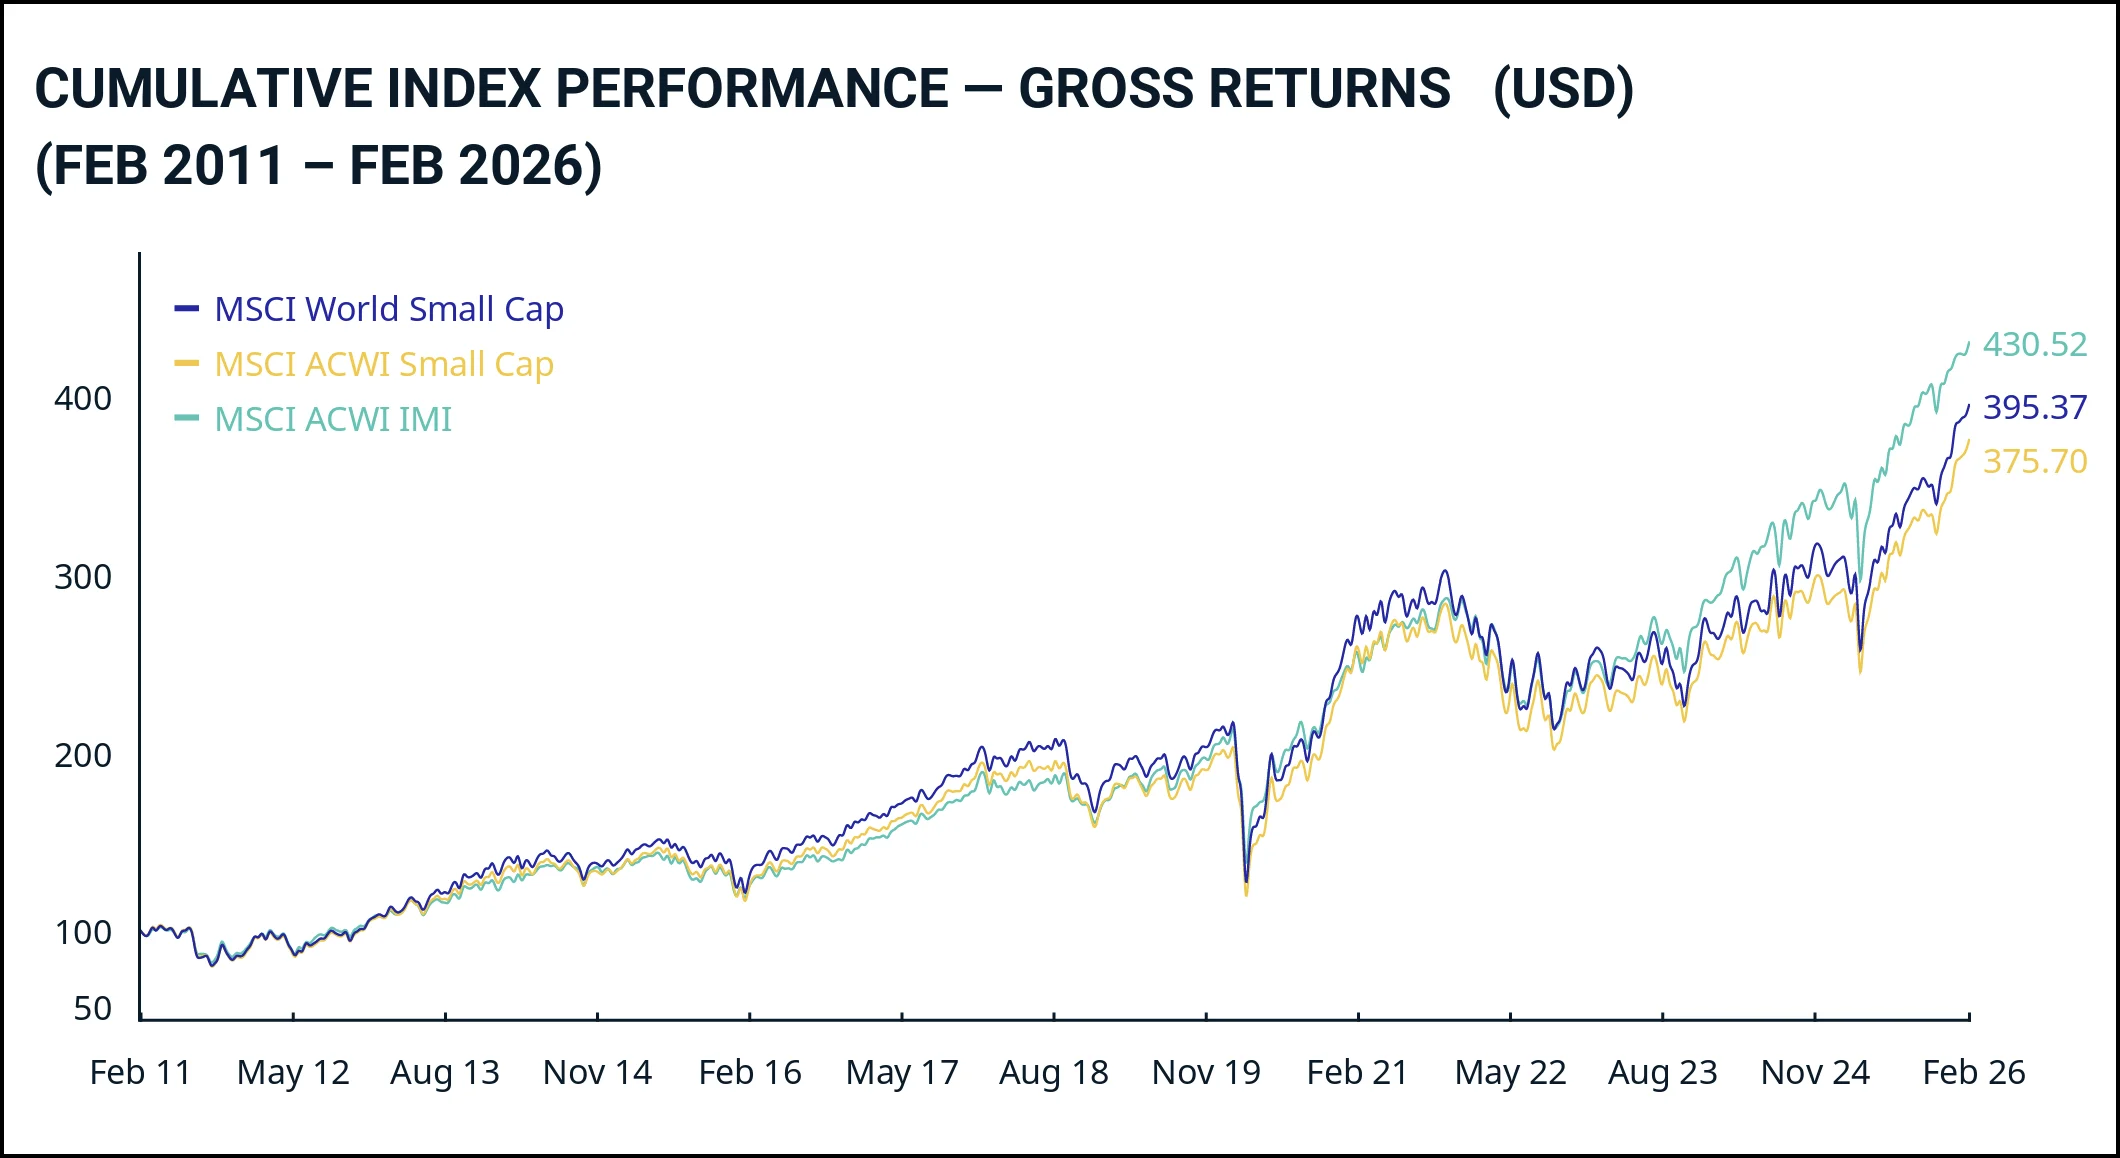
The small-size effect states that small listed companies (small caps) have statistically higher returns than large ones. The basis for the calculation is a company’s market capitalisation, i.e. its stock market value. Index provider MSCI defines the size categories as follows: the largest companies, which make up 70% of the market capitalisation of an index region, are large caps. The next 15% are mid caps. A further 14% are small caps, while the remaining 1% are micro caps. The median market capitalisation of a small cap in the MSCI World Small Cap Index was still around USD 1.580 billion in February 2026.
In other words, only if you hold more than 14% small caps in your portfolio can you speak of a factor-based investment. That’s because 14% is the market-cap weighting.
The largest position in the MSCI World Small Cap Index as of 27 February 2026 is the US tech company Sandisk.
Is the Size factor worth it?
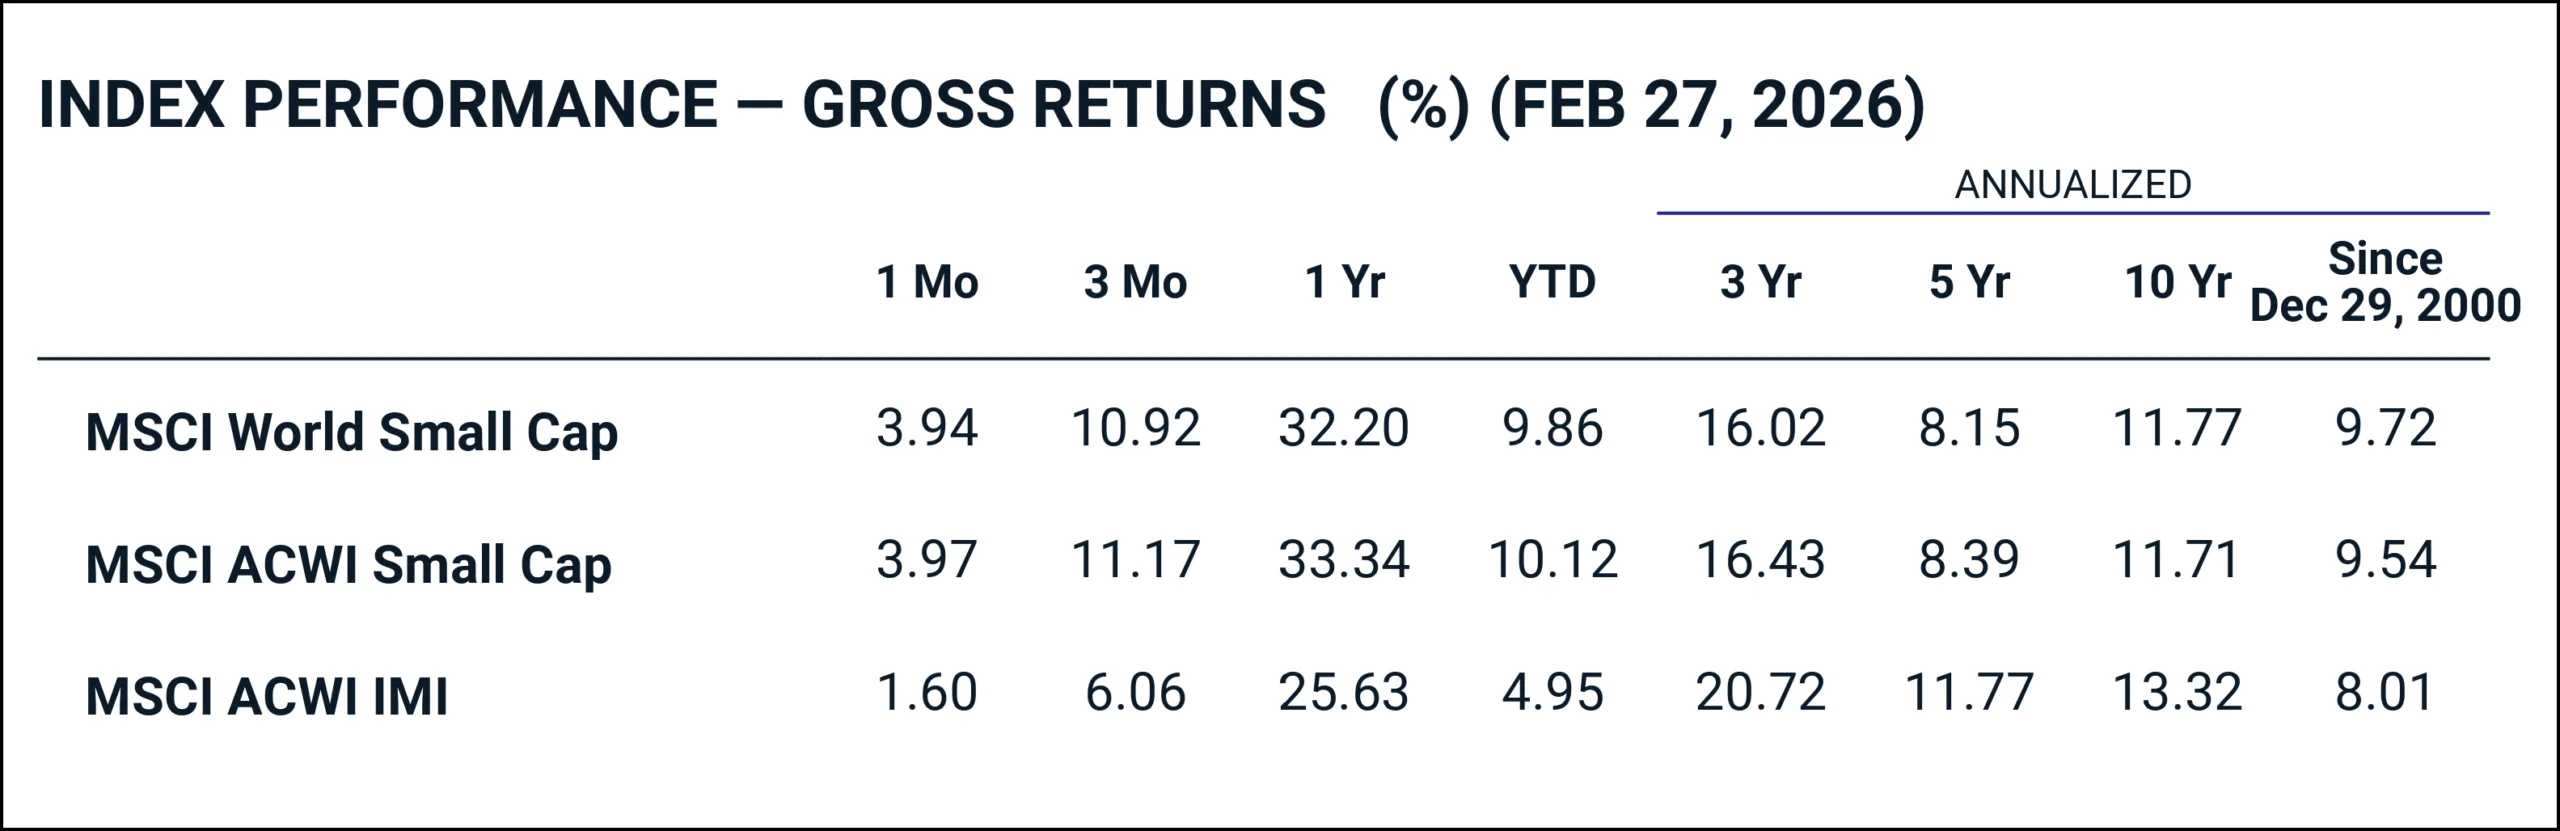
The data shows a mixed picture: over the long term since December 2000, the MSCI World Small Cap achieved 9.72% p.a., an excess return of around 1.7 percentage points over the overall market MSCI ACWI IMI (8.01%). Over the last 10 years, however, small caps underperformed the overall market by 1.55 percentage points, at 11.77% vs. 13.32% – a vivid example of the long dry spells you have to expect with a factor-based investment.
How to invest in the Size factor
If you want to invest in the Size factor, the following two products in particular have become well established on the market:
- iShares MSCI World Small Cap UCITS ETF Acc | IE00BF4RFH31
- State Street SPDR MSCI World Small Cap UCITS ETF USD Unhedged (Acc) | IE00BCBJG560
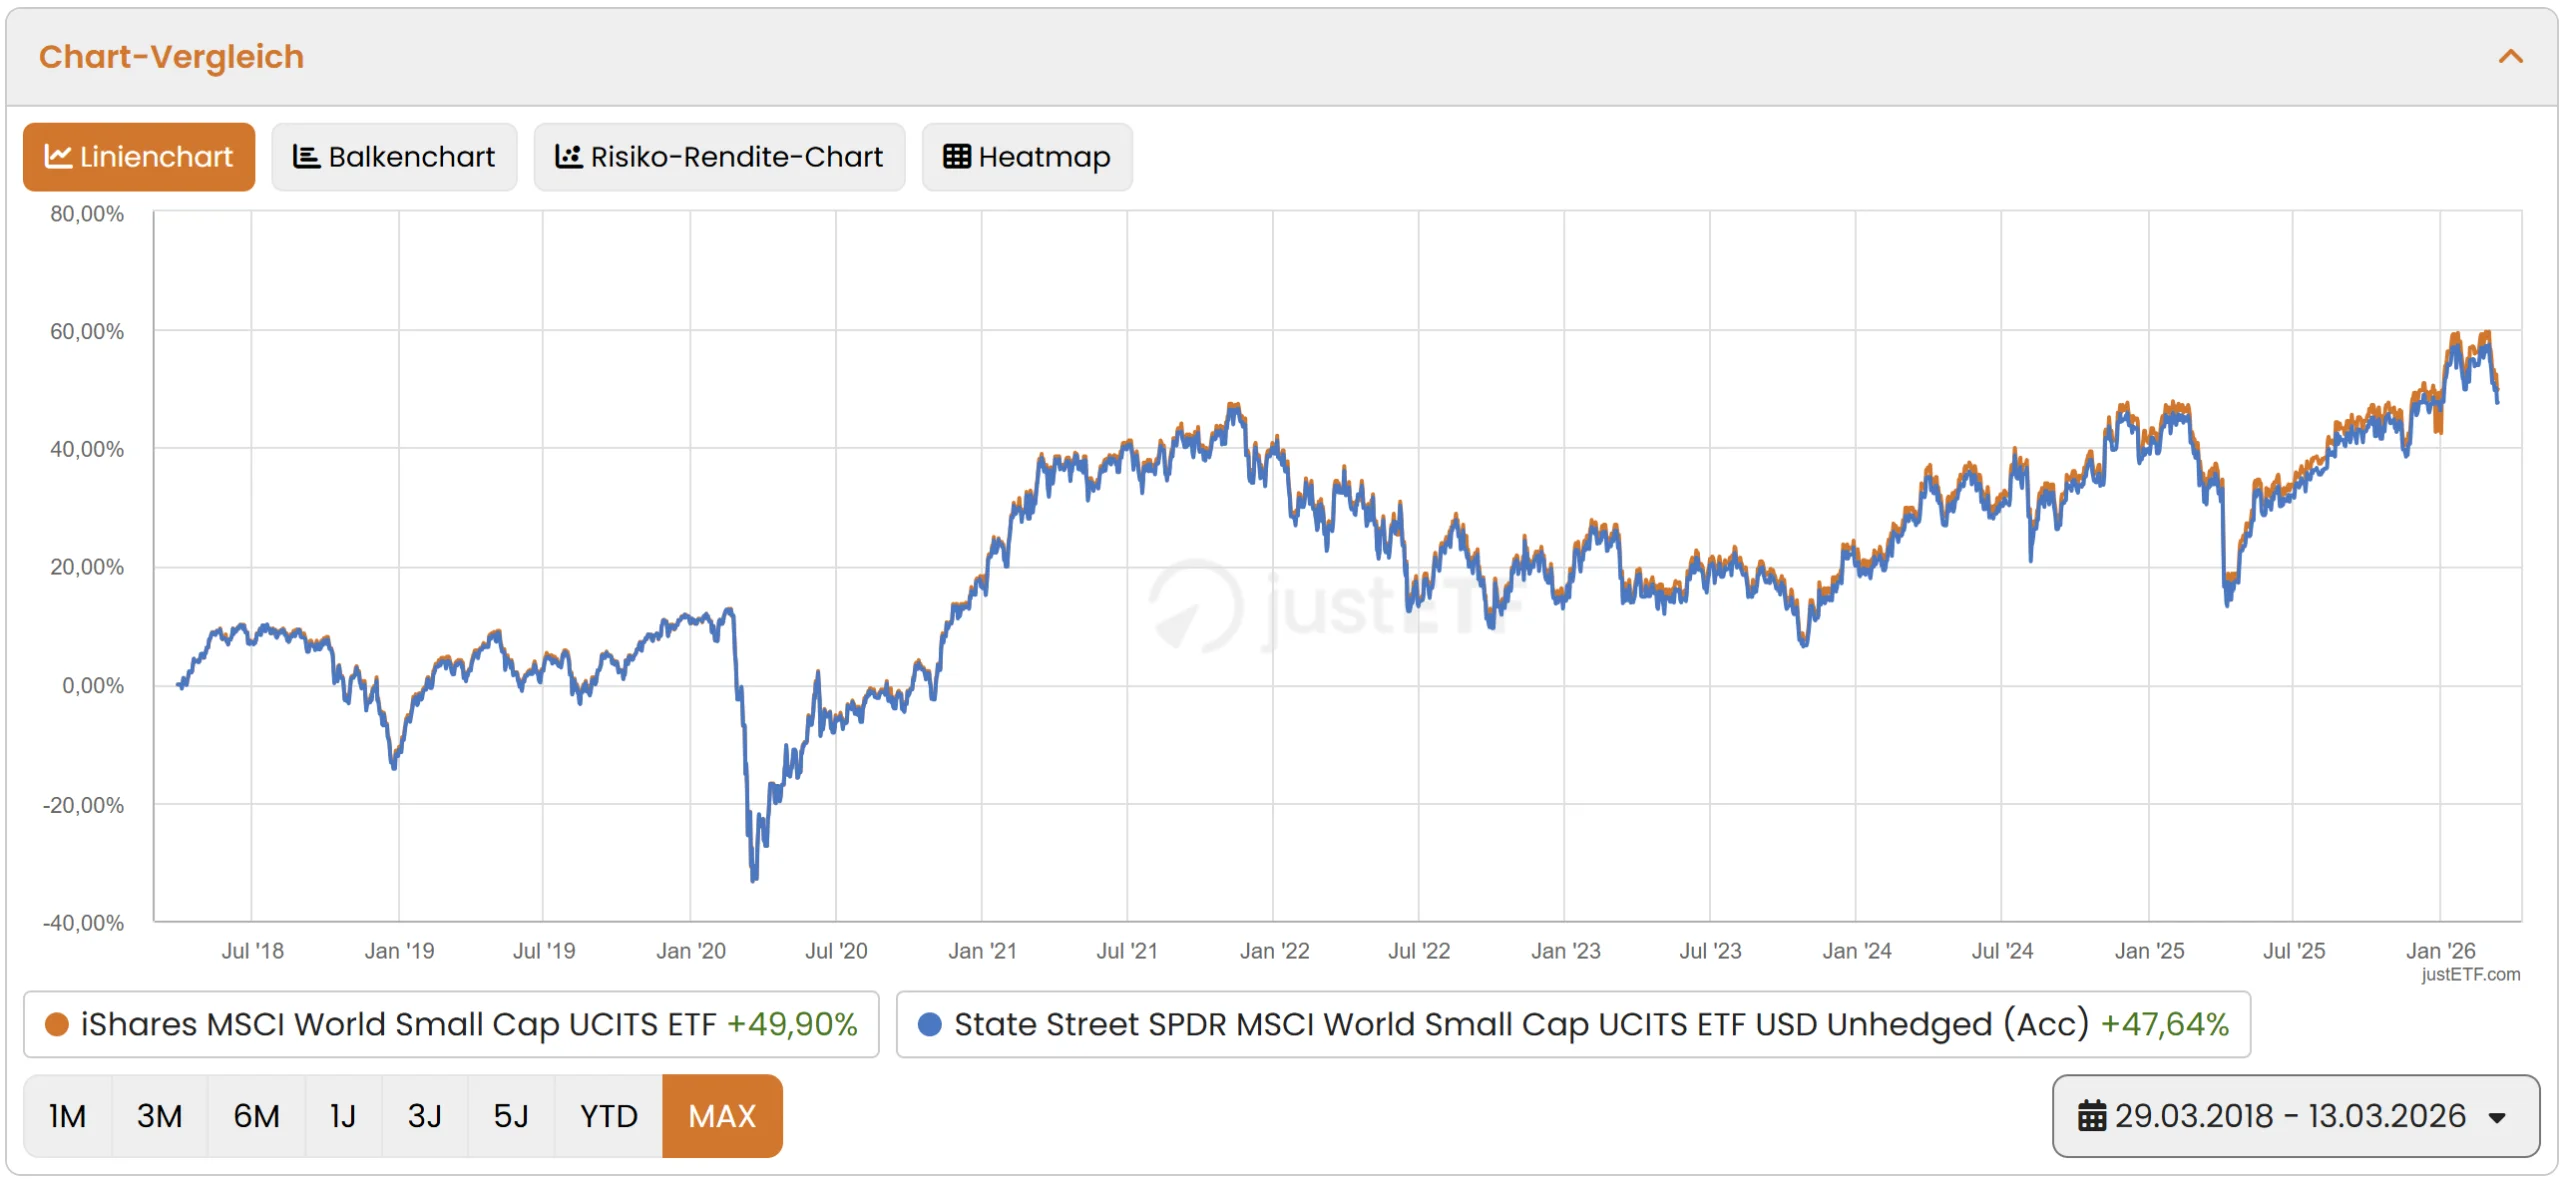
The iShares ETF was launched in March 2018, has a much larger fund size of CHF 5,916 million and impresses with a lower TER of 0.35% p.a. compared with 0.45% for the State Street product. The iShares fund is also slightly ahead in performance since March 2018, at +49.90% vs. +47.64%. The State Street ETF’s only advantage is its longer track record since November 2013. Transparency note: we are invested in the iShares product ourselves.
In the scientific sense (and not stock picking à la Warren Buffett), value stocks have a particularly low share price relative to their fundamentals. This undervaluation is usually measured using the price-to-book ratio (P/B), the price-to-earnings ratio (P/E), the dividend yield and free cash flow.
The largest position in the MSCI World Value as of 27 February 2026 is – quite surprisingly – Google’s parent Alphabet. Despite its growth character, the tech giant counts as a value stock thanks to a price-to-earnings ratio (P/E) that is relatively low compared with its industry.
Is the Value factor worth it?
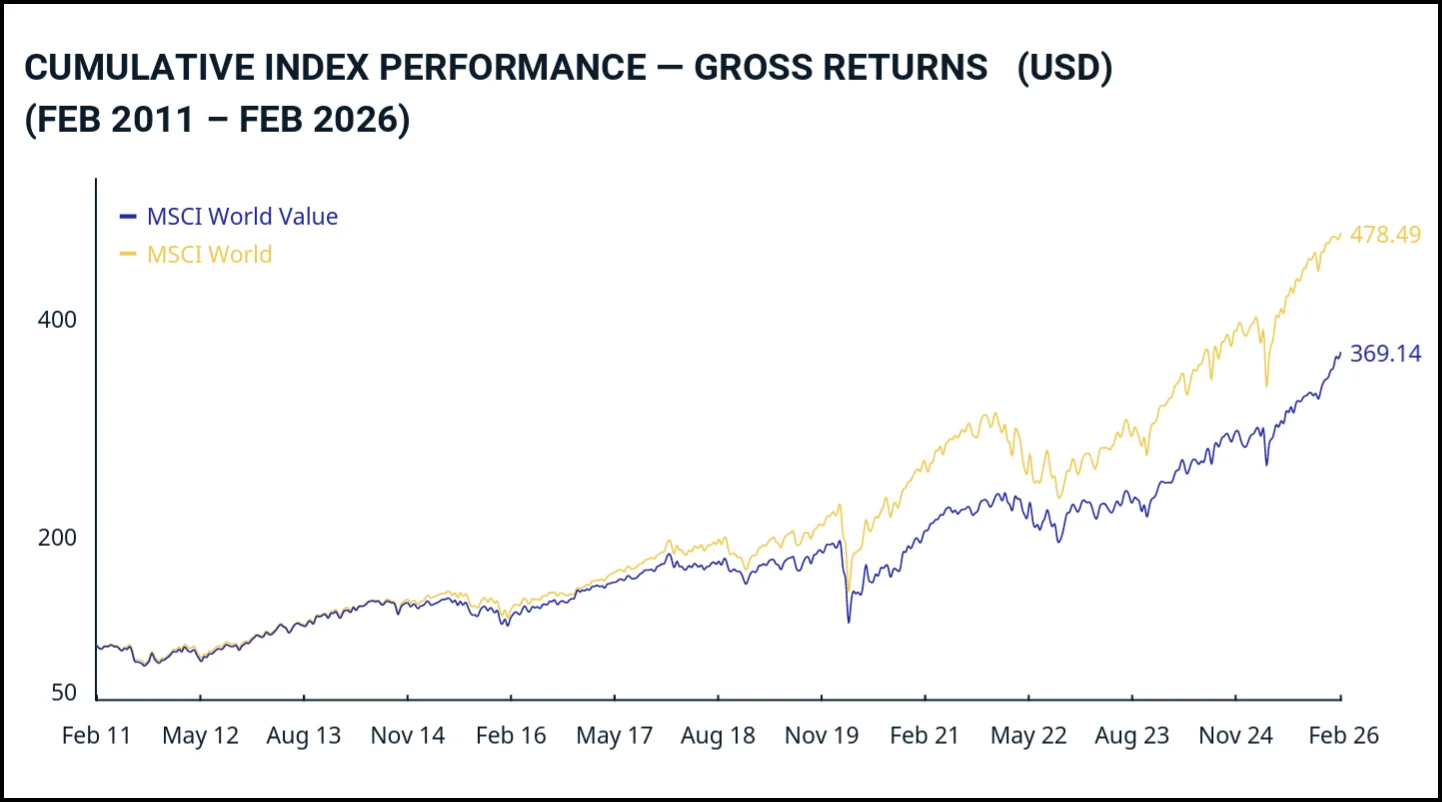
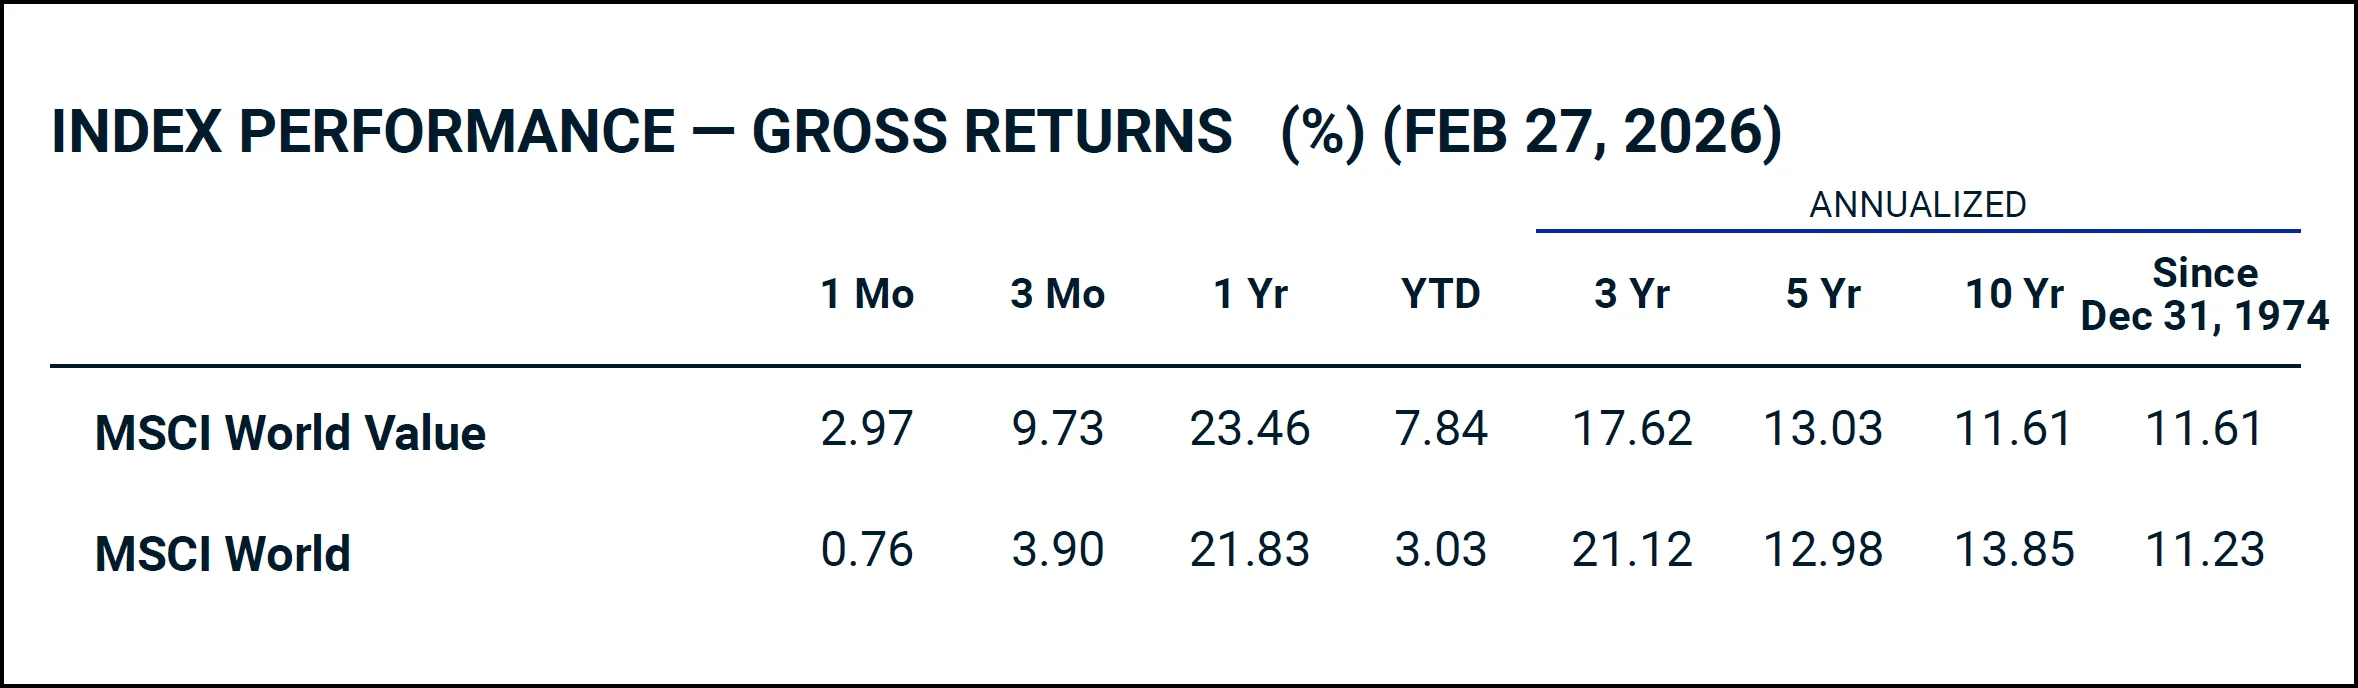
The data paints a sobering picture: over the last 15 years, the MSCI World Value has clearly underperformed the market-cap-weighted MSCI World – driven by the dominance of US tech stocks. The long-term comparison since 1974 does show a marginal excess return of 0.38 percentage points (11.61% vs. 11.23%), but that is before costs and taxes. Once you deduct the higher product costs and the extra tax burden from dividend distributions, the premium largely disappears – which is why we remain sceptical about the Value factor.
How to invest in the Value factor
If you still want to invest in the Value factor, the following two products are worth a look:
- Xtrackers MSCI World Value UCITS ETF 1C | IE00BL25JM42
- iShares Edge MSCI World Value Factor UCITS ETF | IE00BP3QZB59
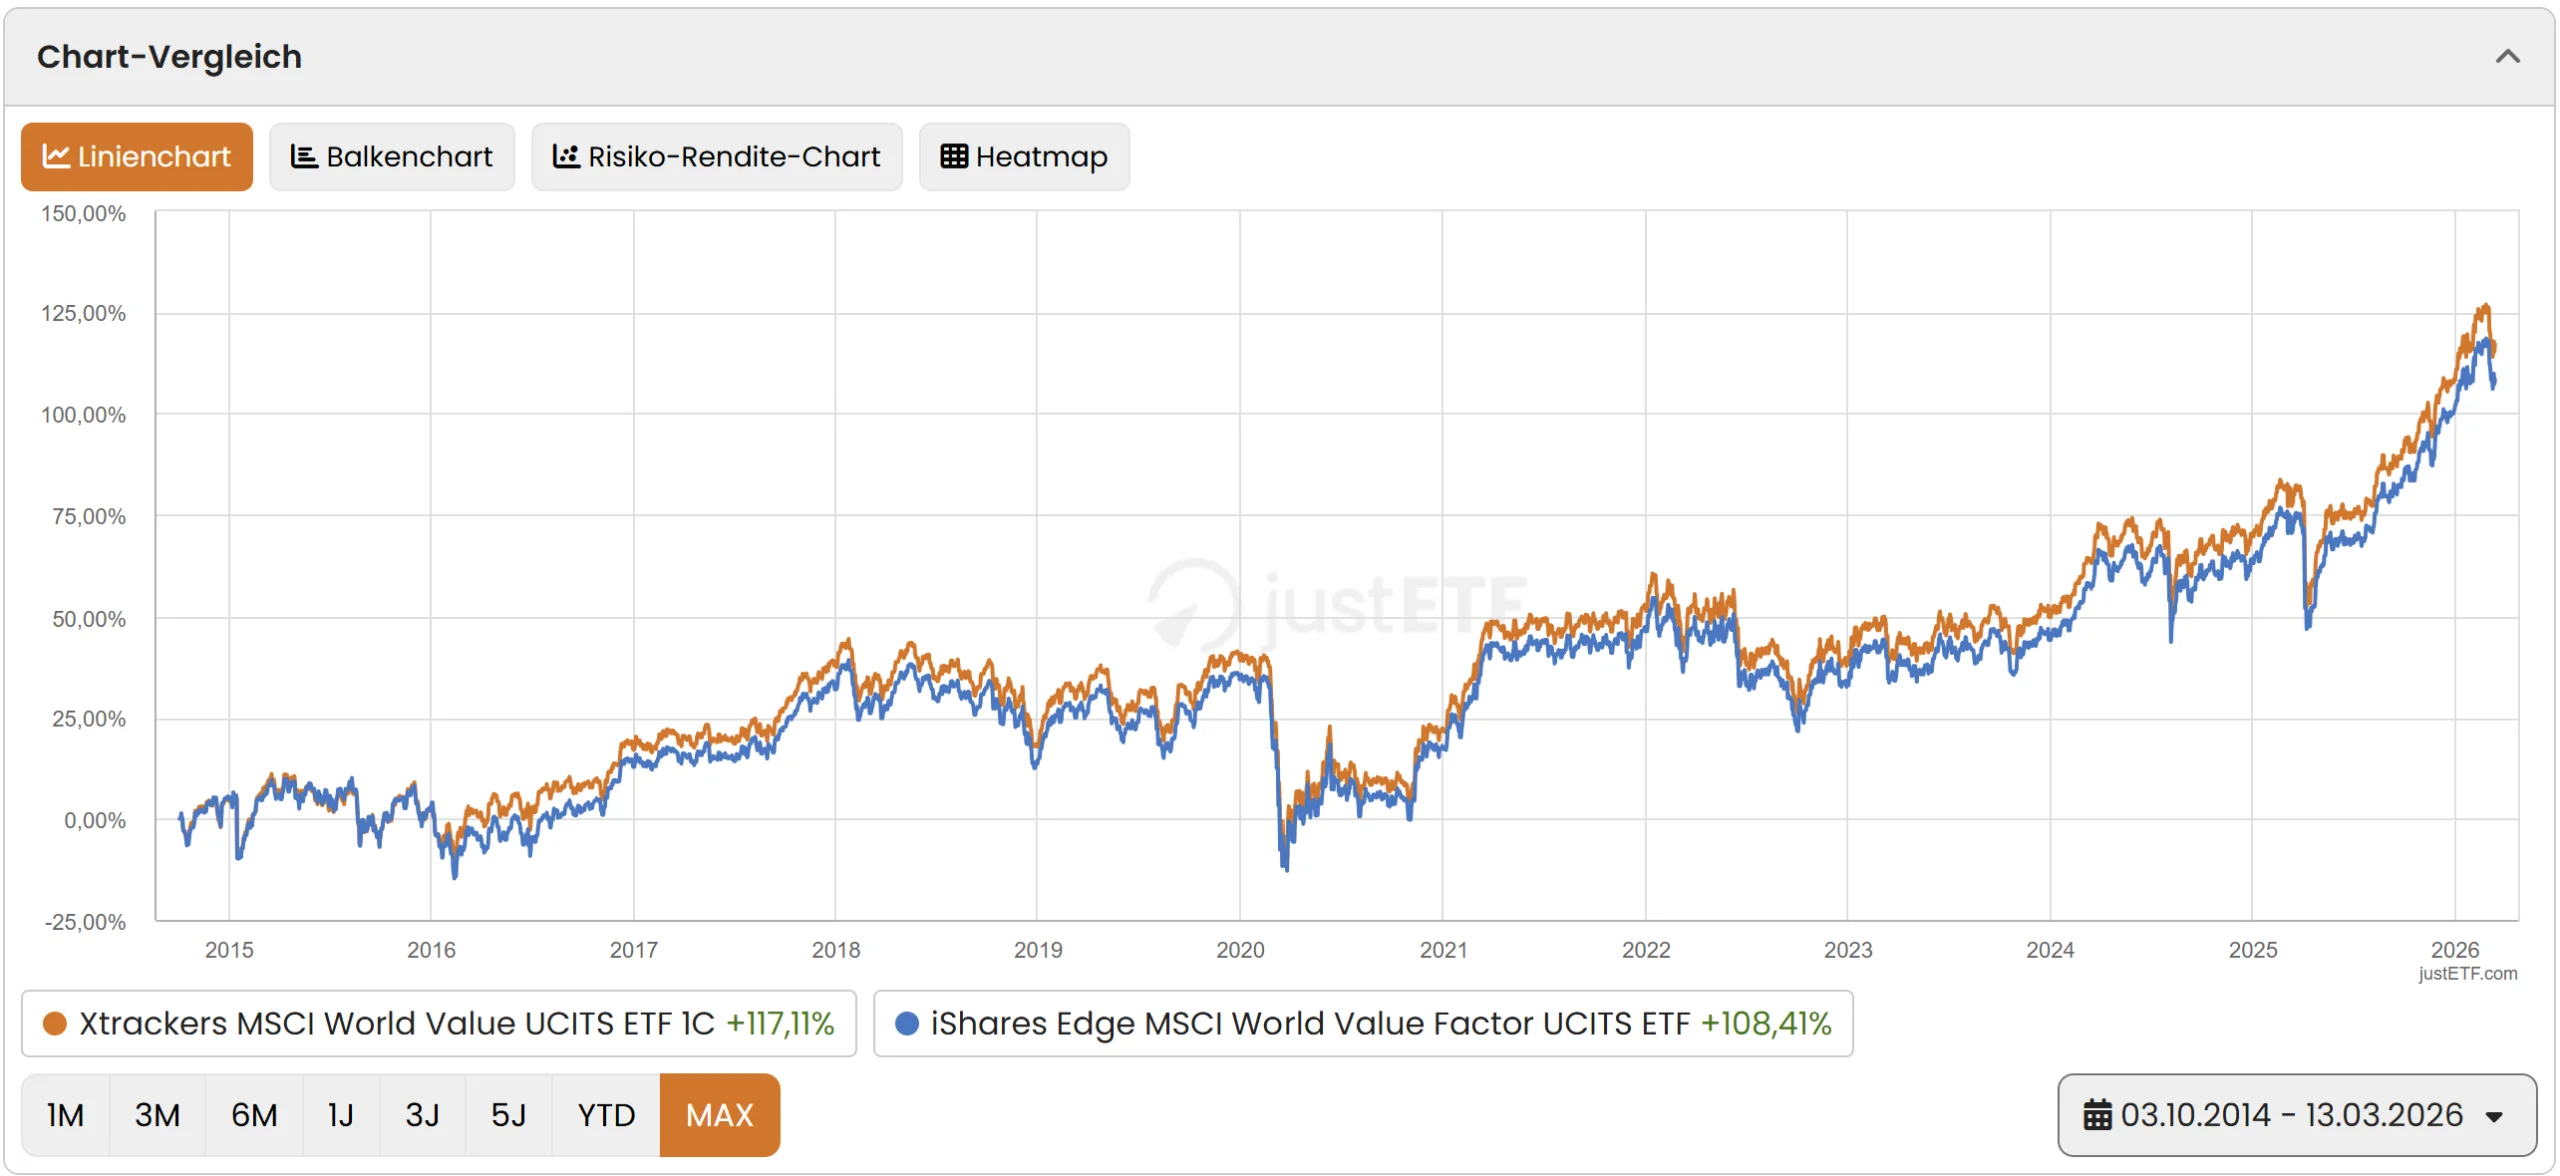
Both ETFs were launched in 2014 and impress with a fair TER of 0.25% p.a. Since launch, the Xtrackers ETF has performed better, at +117% vs. +108% for the iShares product – albeit with a smaller fund size (CHF 3,381 million vs. CHF 4,508 million).
Stocks that have performed better than the market in the past also deliver higher returns in the near future. Put simply, that is the basic idea behind the momentum premium. It is therefore based on relative returns and includes stocks that have stood out with above-average performance over the last 6 and 12 months.
The largest position in the MSCI World Momentum as of 27 February 2026 is the Californian semiconductor and software company Broadcom.
Is the Momentum factor worth it?
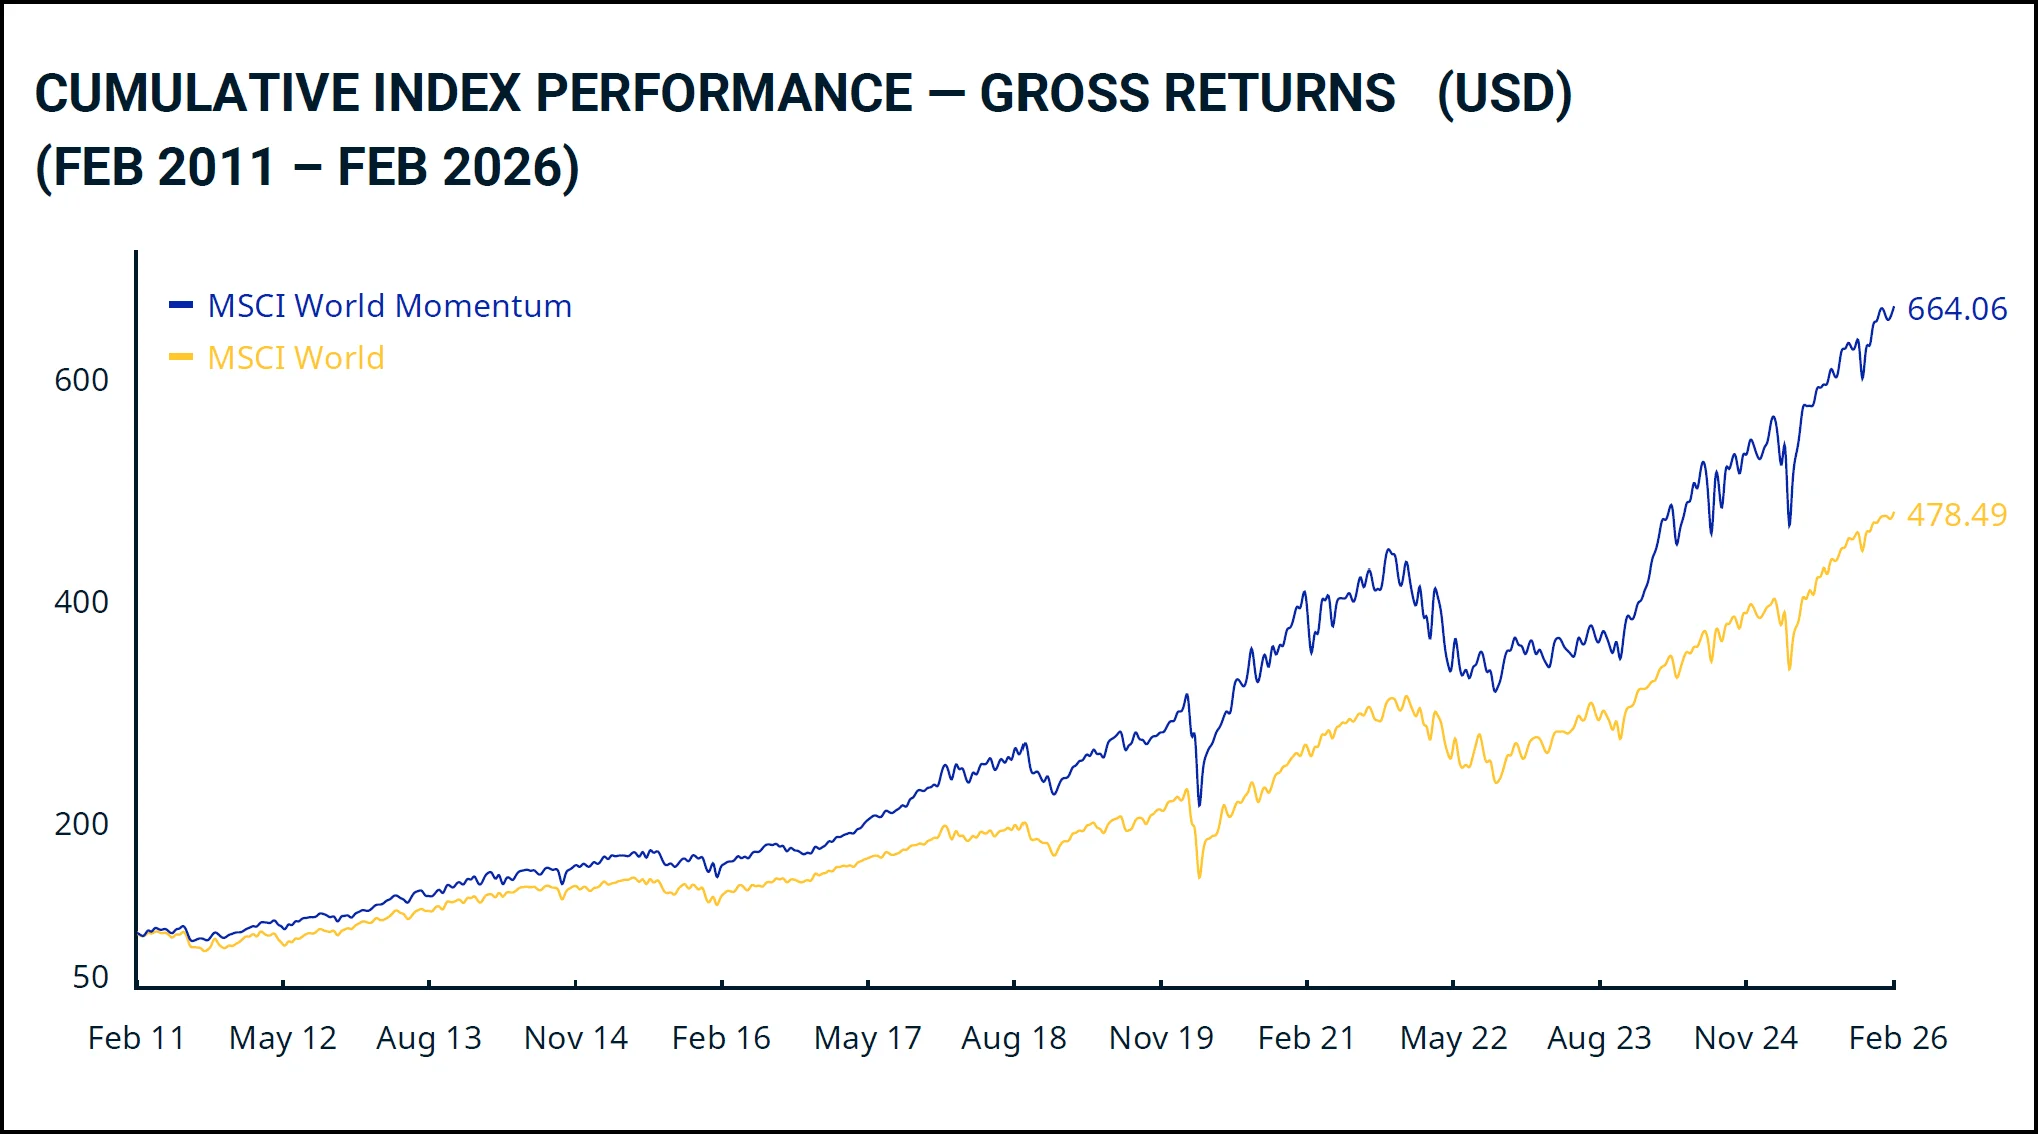
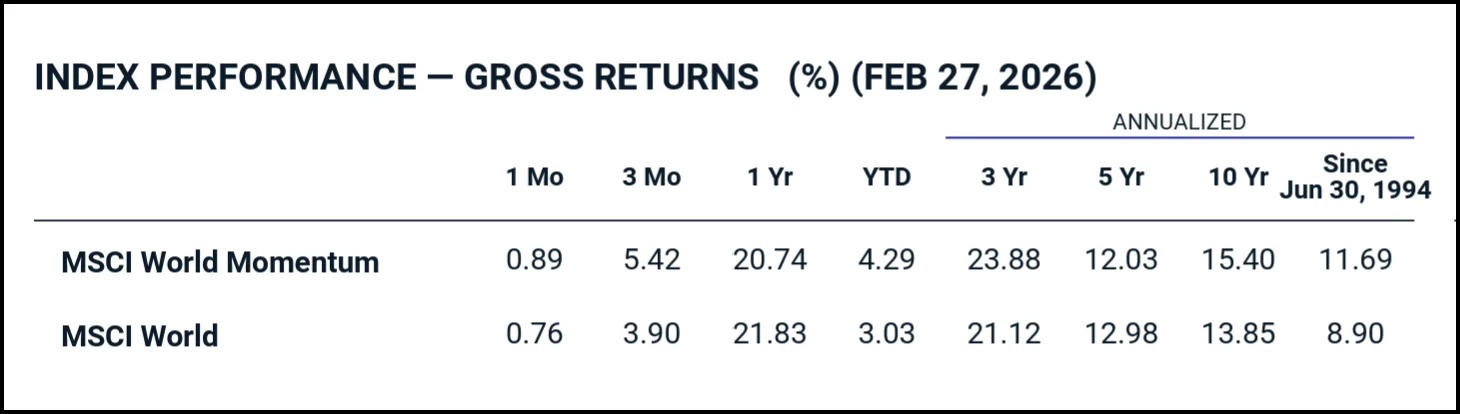
The data speaks for itself: over the last 15 years, the MSCI World Momentum has clearly outperformed the market-cap-weighted MSCI World, at 664 vs. 478 points. In the long-term comparison since 1994, the Momentum factor also impresses with an annualised return of 11.69% compared with 8.90% for the MSCI World – an excess return of 2.79 percentage points over around 32 years. This makes the Momentum factor one of the best-documented factors in research and one of the most convincing in practice.
Bear in mind, however, that the Momentum factor can also go through longer dry spells. During the 2020 COVID crash, both indices lost a great deal of value – but in the recovery that followed, the Momentum index lagged well behind the overall market.
How to invest in the Momentum factor
The choice of momentum ETFs is limited – but the following two products stand out on their key figures:
- iShares Edge MSCI World Momentum Factor UCITS ETF Acc | IE00BP3QZ825
- Xtrackers MSCI World Momentum UCITS ETF 1C | IE00BL25JP72
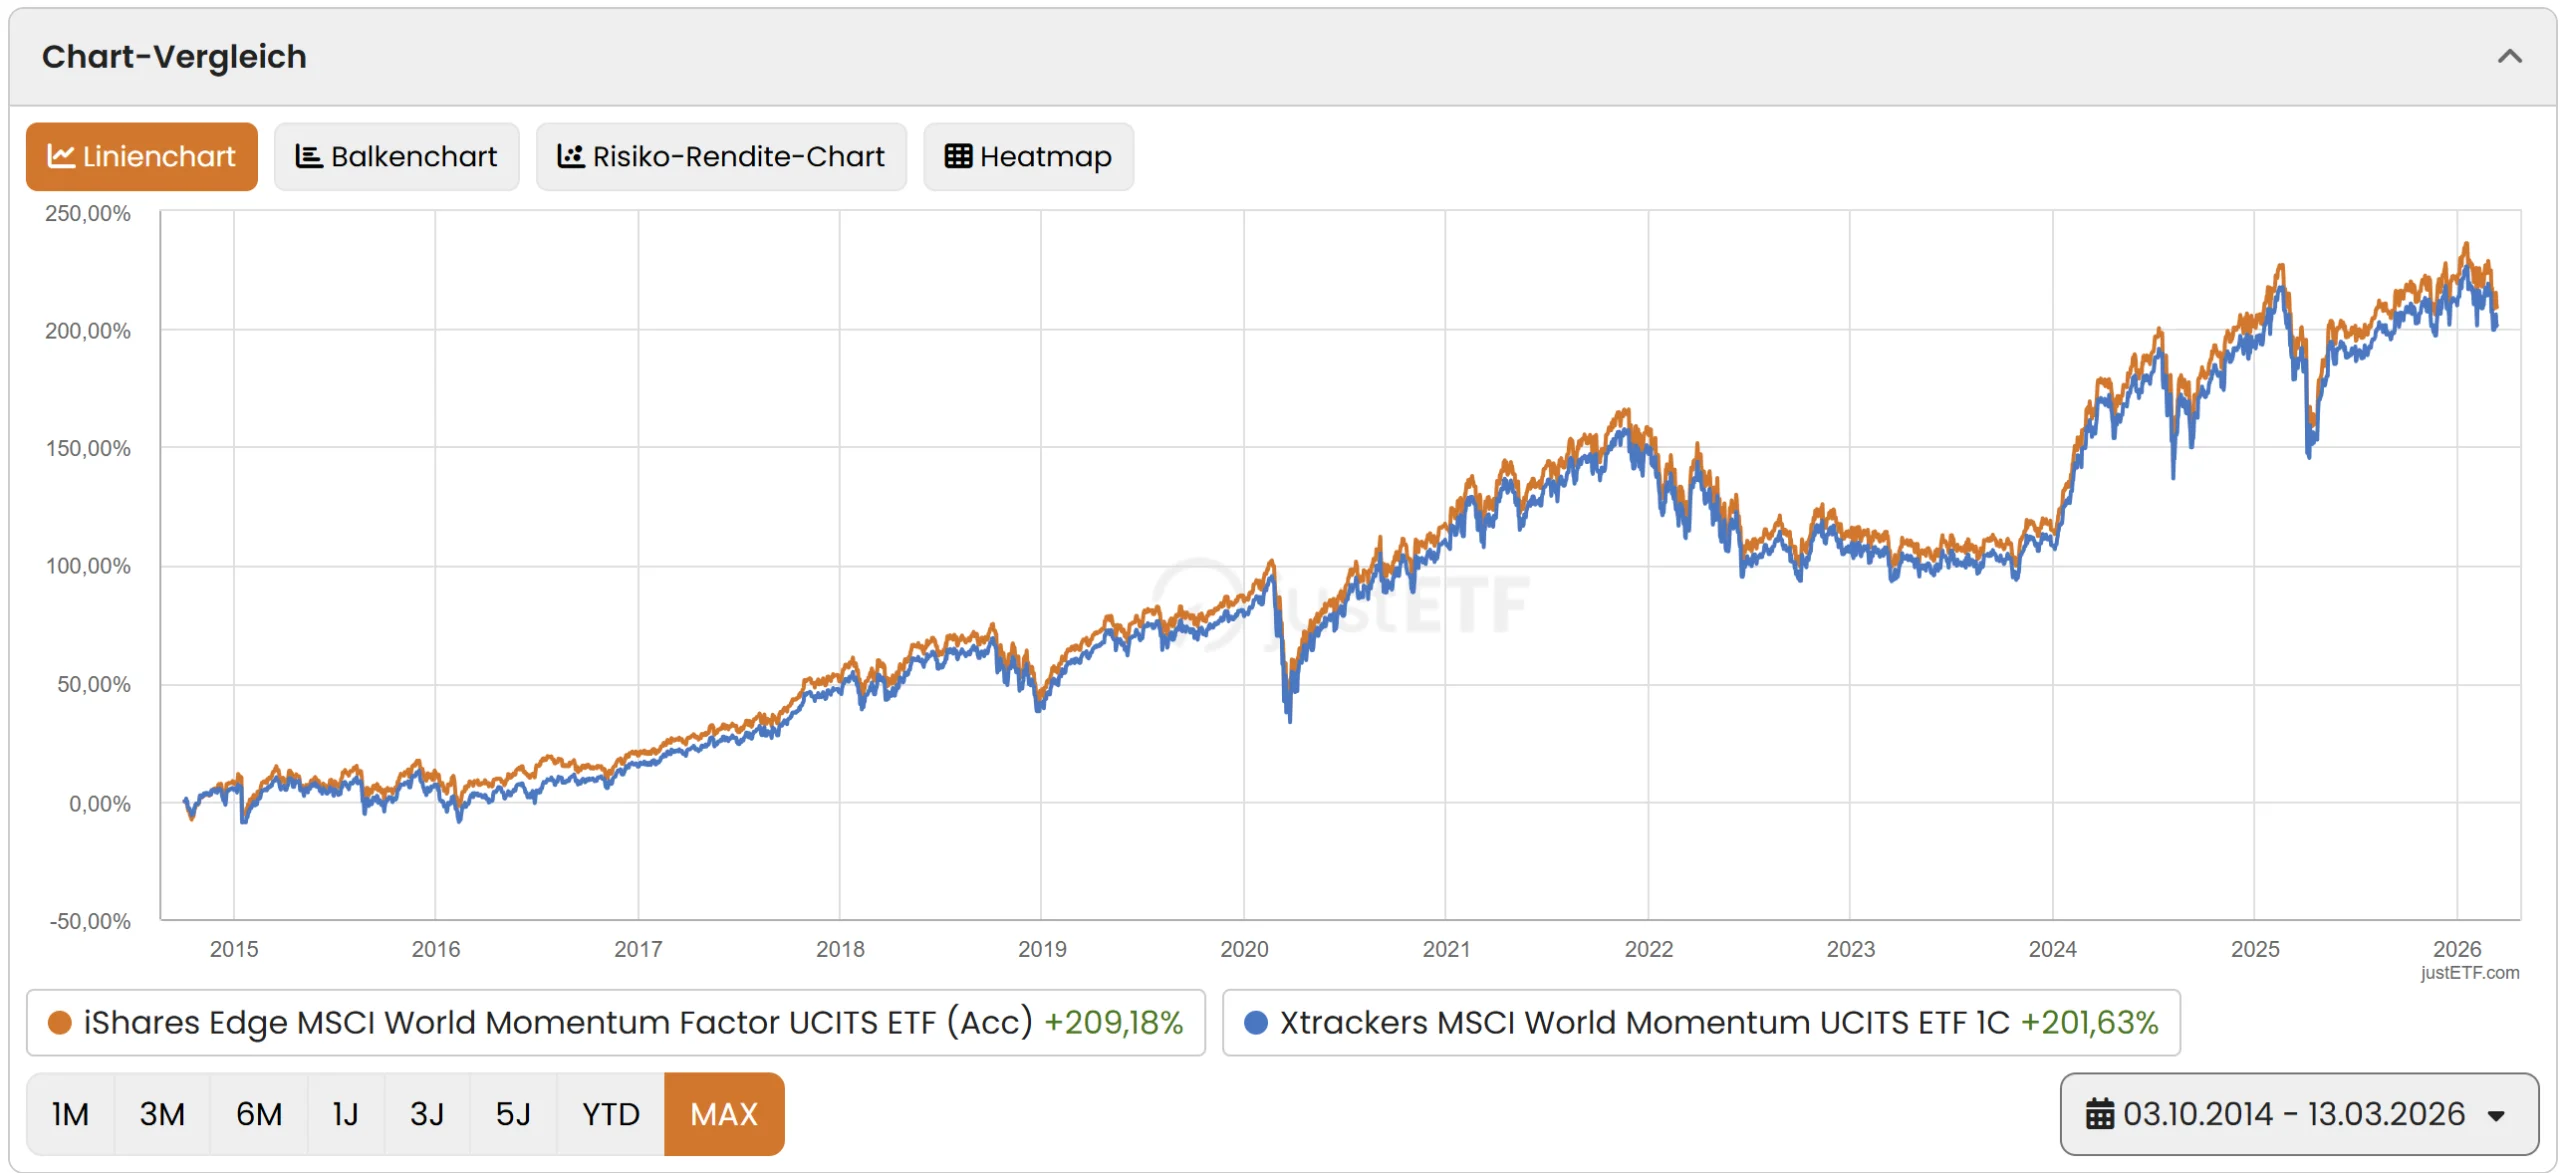
Both ETFs were launched in 2014 and impress with a fair TER of 0.25% p.a. Since launch, the iShares ETF has performed somewhat better, at +209% vs. +202% for the Xtrackers product – and it also has a much larger fund size (CHF 3,070 million vs. CHF 1,432 million).
Quality stocks typically have three characteristics: a high return on equity (ROE), stable and predictable earnings and low debt. As there is no uniform scientific definition, the exact measurement varies from provider to provider – the MSCI World Quality Index, for example, is based on exactly these three fundamental variables.
Worth mentioning in this context is the investment factor from Fama and French’s five-factor model: it describes the observation that companies with conservative investment behaviour perform better in the long run than aggressively expanding ones. As it is closely related to the Quality factor and there are hardly any dedicated ETF products, we do not treat it as a separate factor.
The largest position in the MSCI World Quality as of 27 February 2026 is Meta – the operator of Facebook, Instagram and WhatsApp.
Is the Quality factor worth it?
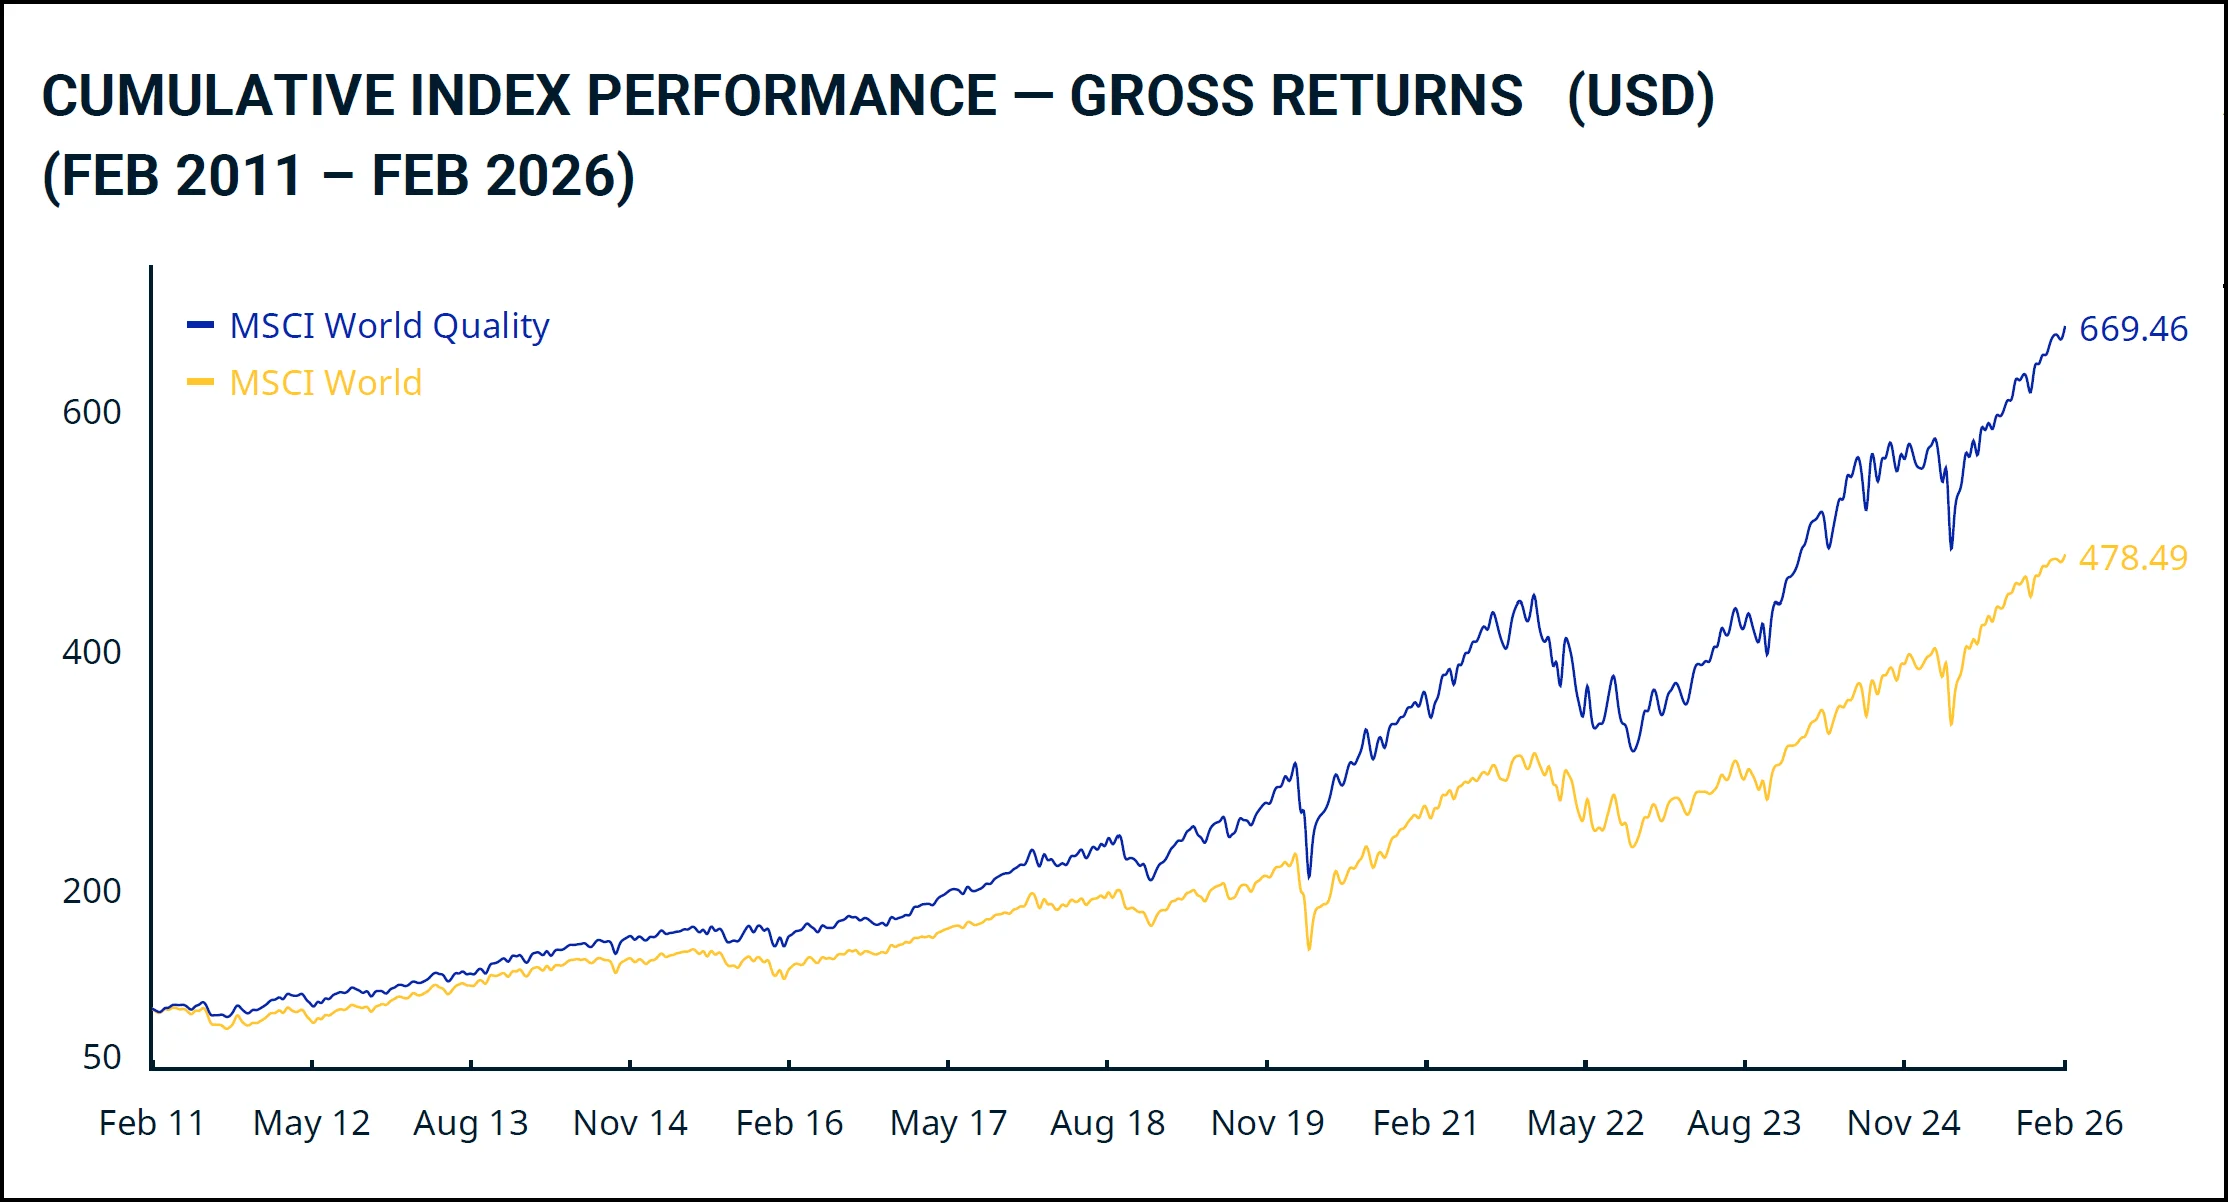
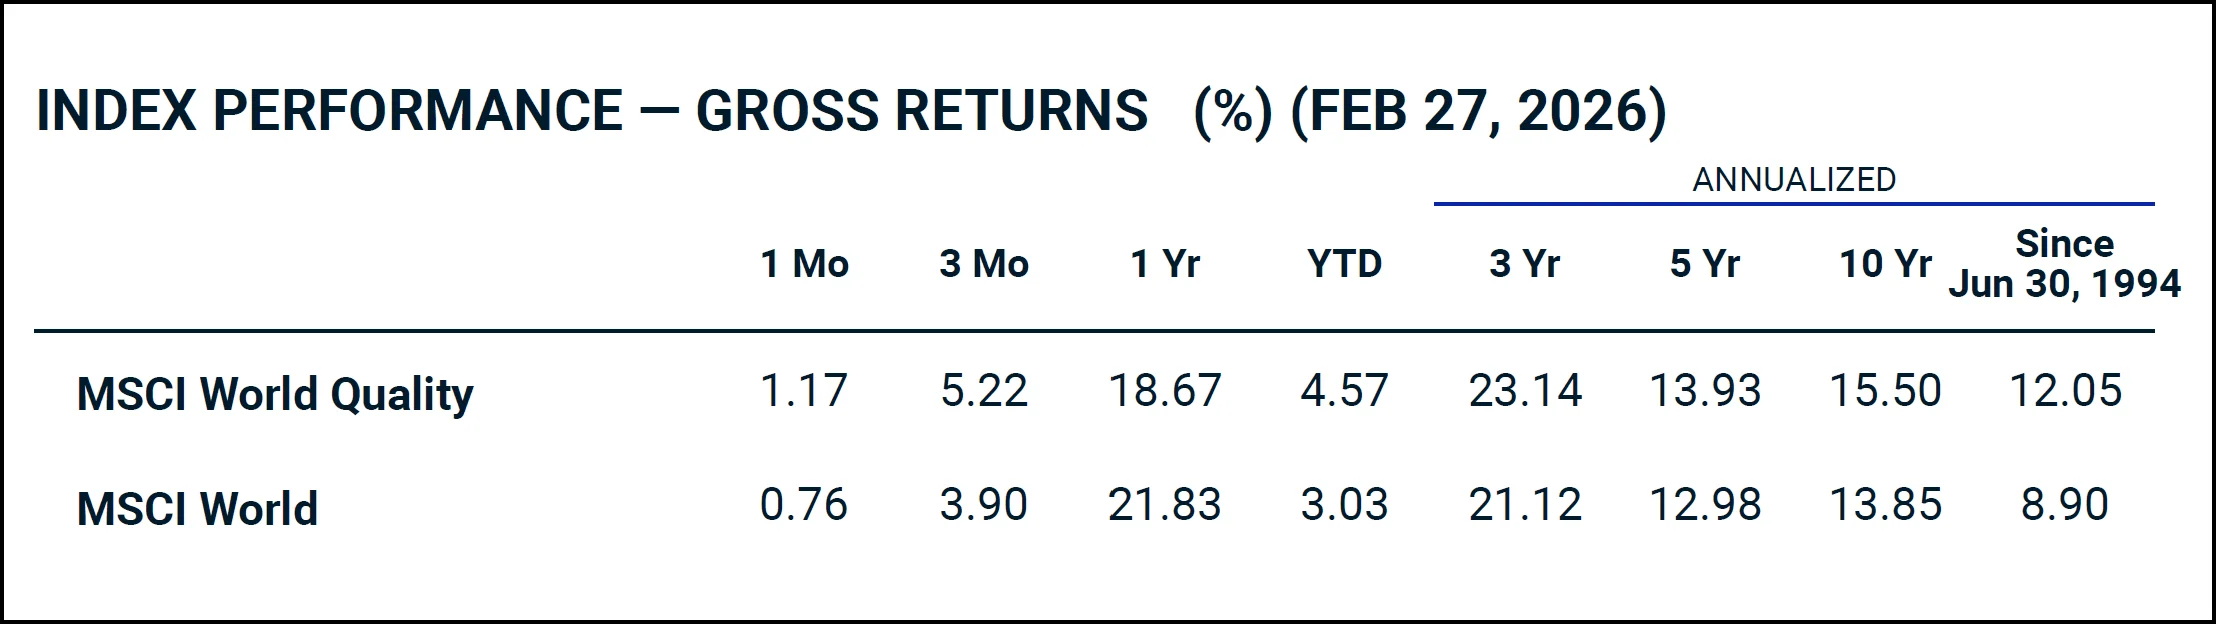
The Quality factor impresses with one of the strongest long-term premiums in this comparison: since 1994, the MSCI World Quality has beaten the overall market by 3.15 percentage points a year. Particularly noteworthy is that, thanks to their solid balance sheets and stable earnings, quality stocks tend to be more resilient than the broad market in times of crisis. The premium is well documented in research and is considered more robust than, for example, the Value or Size factor.
How to invest in the Quality factor
For the Quality factor, you can choose between two convincing products:
- Xtrackers MSCI World Quality UCITS ETF 1C | IE00BL25JL35
- iShares Edge MSCI World Quality Factor UCITS ETF (Acc) | IE00BP3QZ601
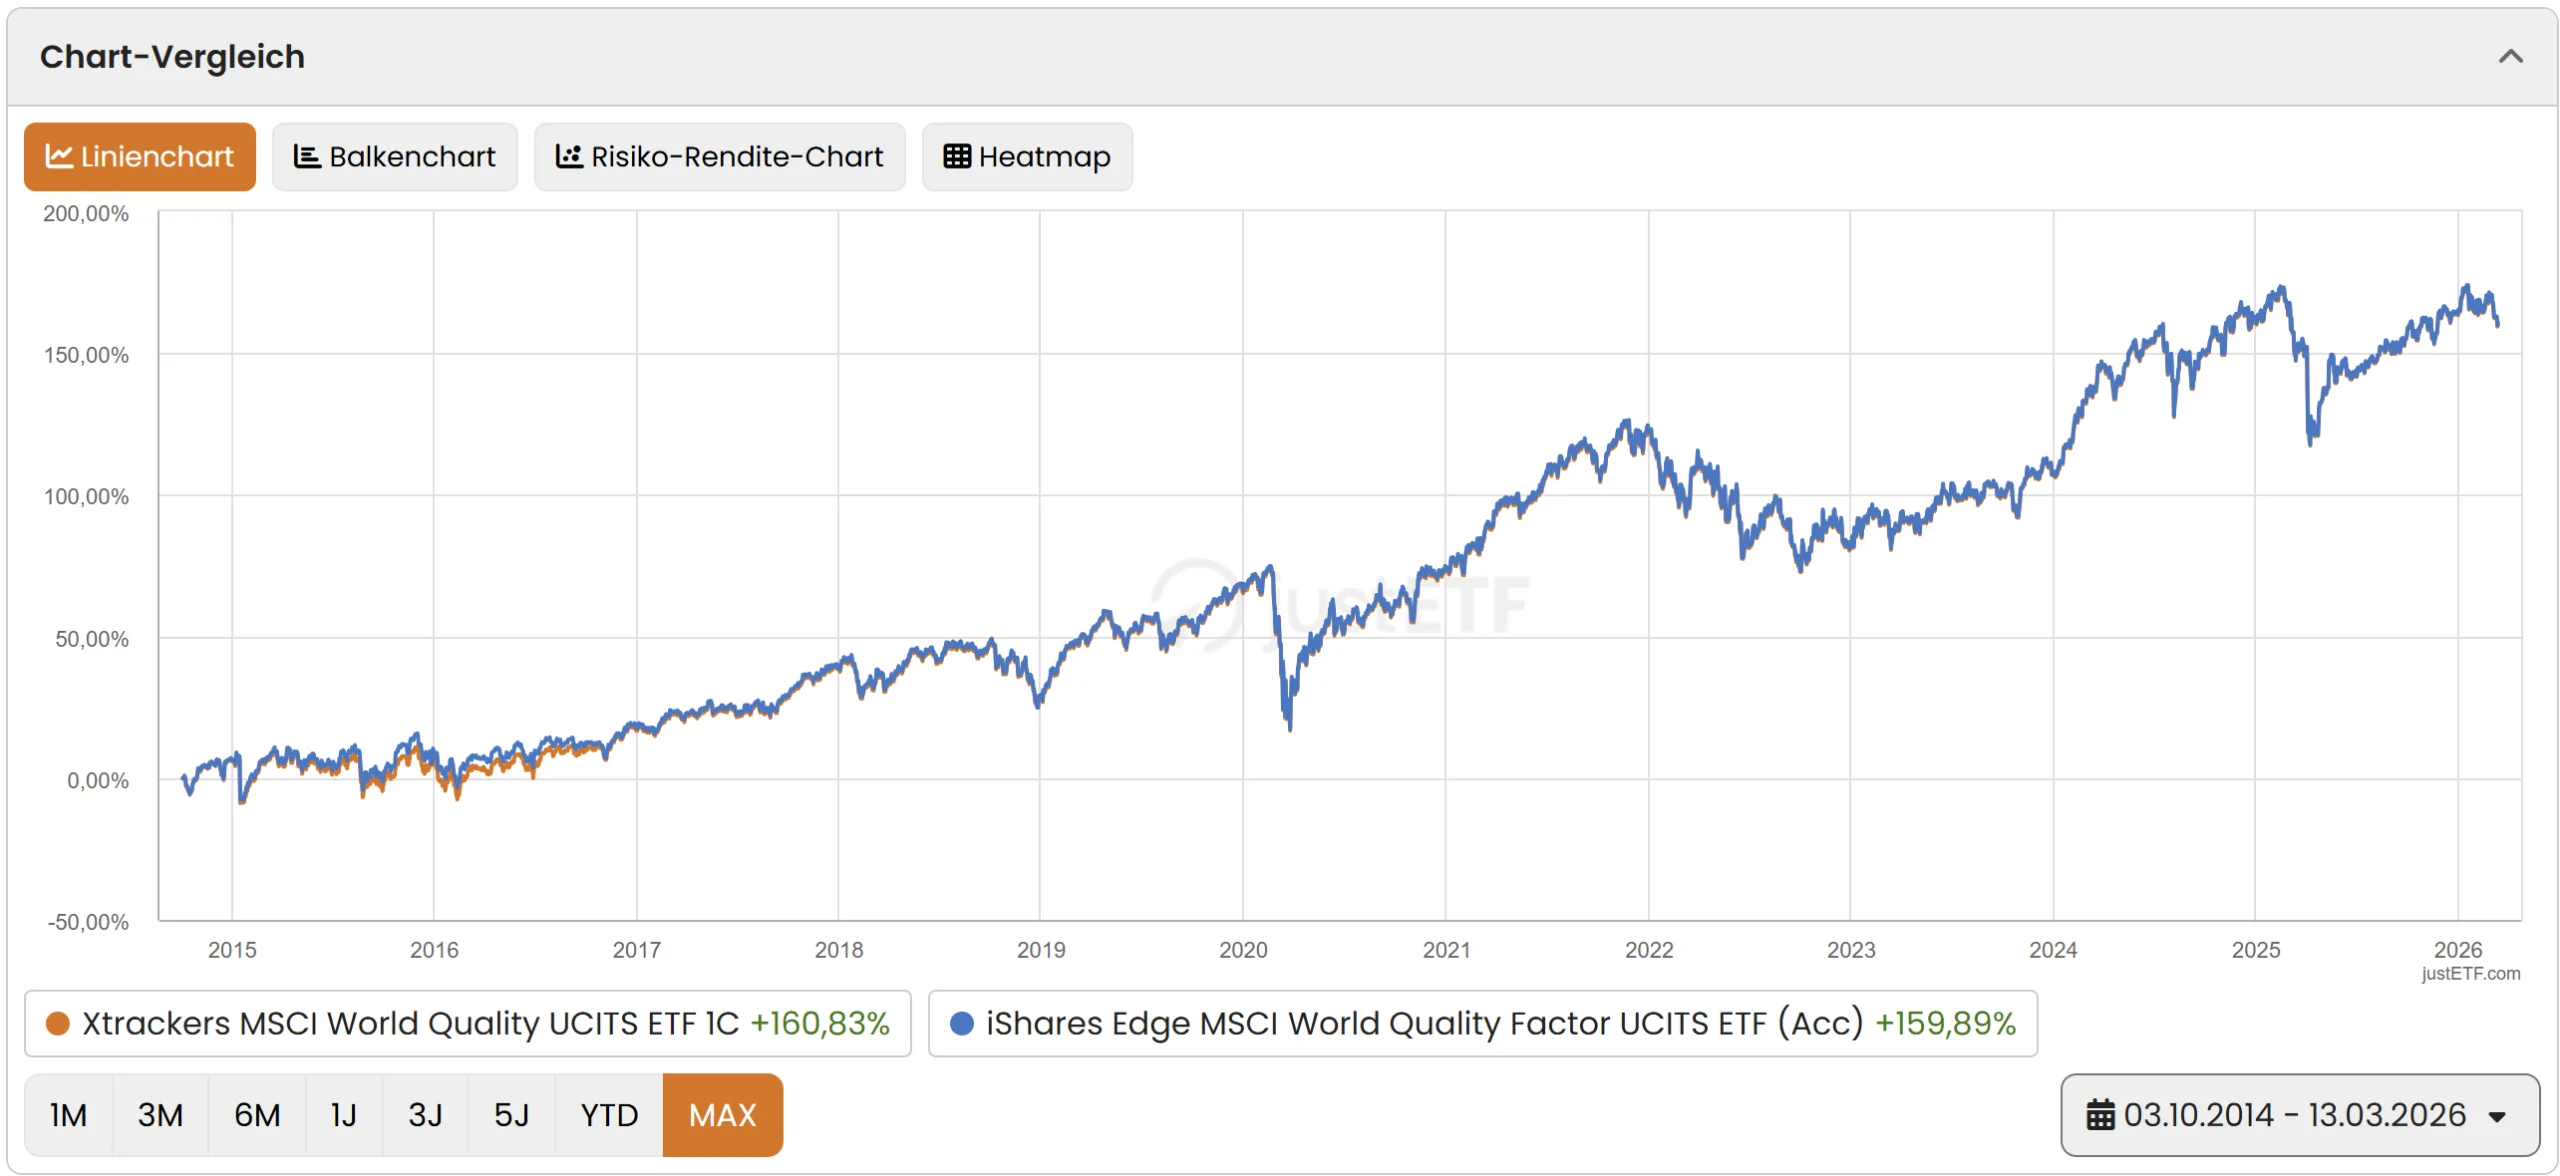
Both ETFs were launched in October 2014 and impress with a fair TER of 0.25% p.a. Since launch, the Xtrackers ETF has performed marginally better, at +161% vs. +160% for the iShares product – while the iShares fund impresses with a much larger fund size (CHF 3,587 million vs. CHF 2,109 million).
This factor premium relates to equities from emerging markets. It is essentially explained as compensation for higher risk, resulting from political instability, corruption or a deficient legal system and lack of separation of powers, among other things.
Unlike the previous factors – Size, Value, Momentum and Quality – Political Risk is not based on the fundamentals of the companies themselves. Selection is based solely on geographical origin: a company counts because it is based in an emerging market – regardless of its size, valuation or quality.
Whether emerging markets count as a separate factor has not been conclusively settled by research – they do not appear in the well-known factor models of Fama and French. However, Gerd Kommer, author of the standard work “Souverän investieren mit ETFs”, treats the higher political risk of these markets as a separate risk premium – and we share this view.
The largest position in the MSCI Emerging Markets as of 27 February 2026 is the Asian chip giant Taiwan Semiconductor – a global corporation that MSCI classifies as an emerging markets stock solely because of its domicile. Rival index provider FTSE, on the other hand, already classifies Taiwan as a developed market.
Is the Political Risk factor worth it?
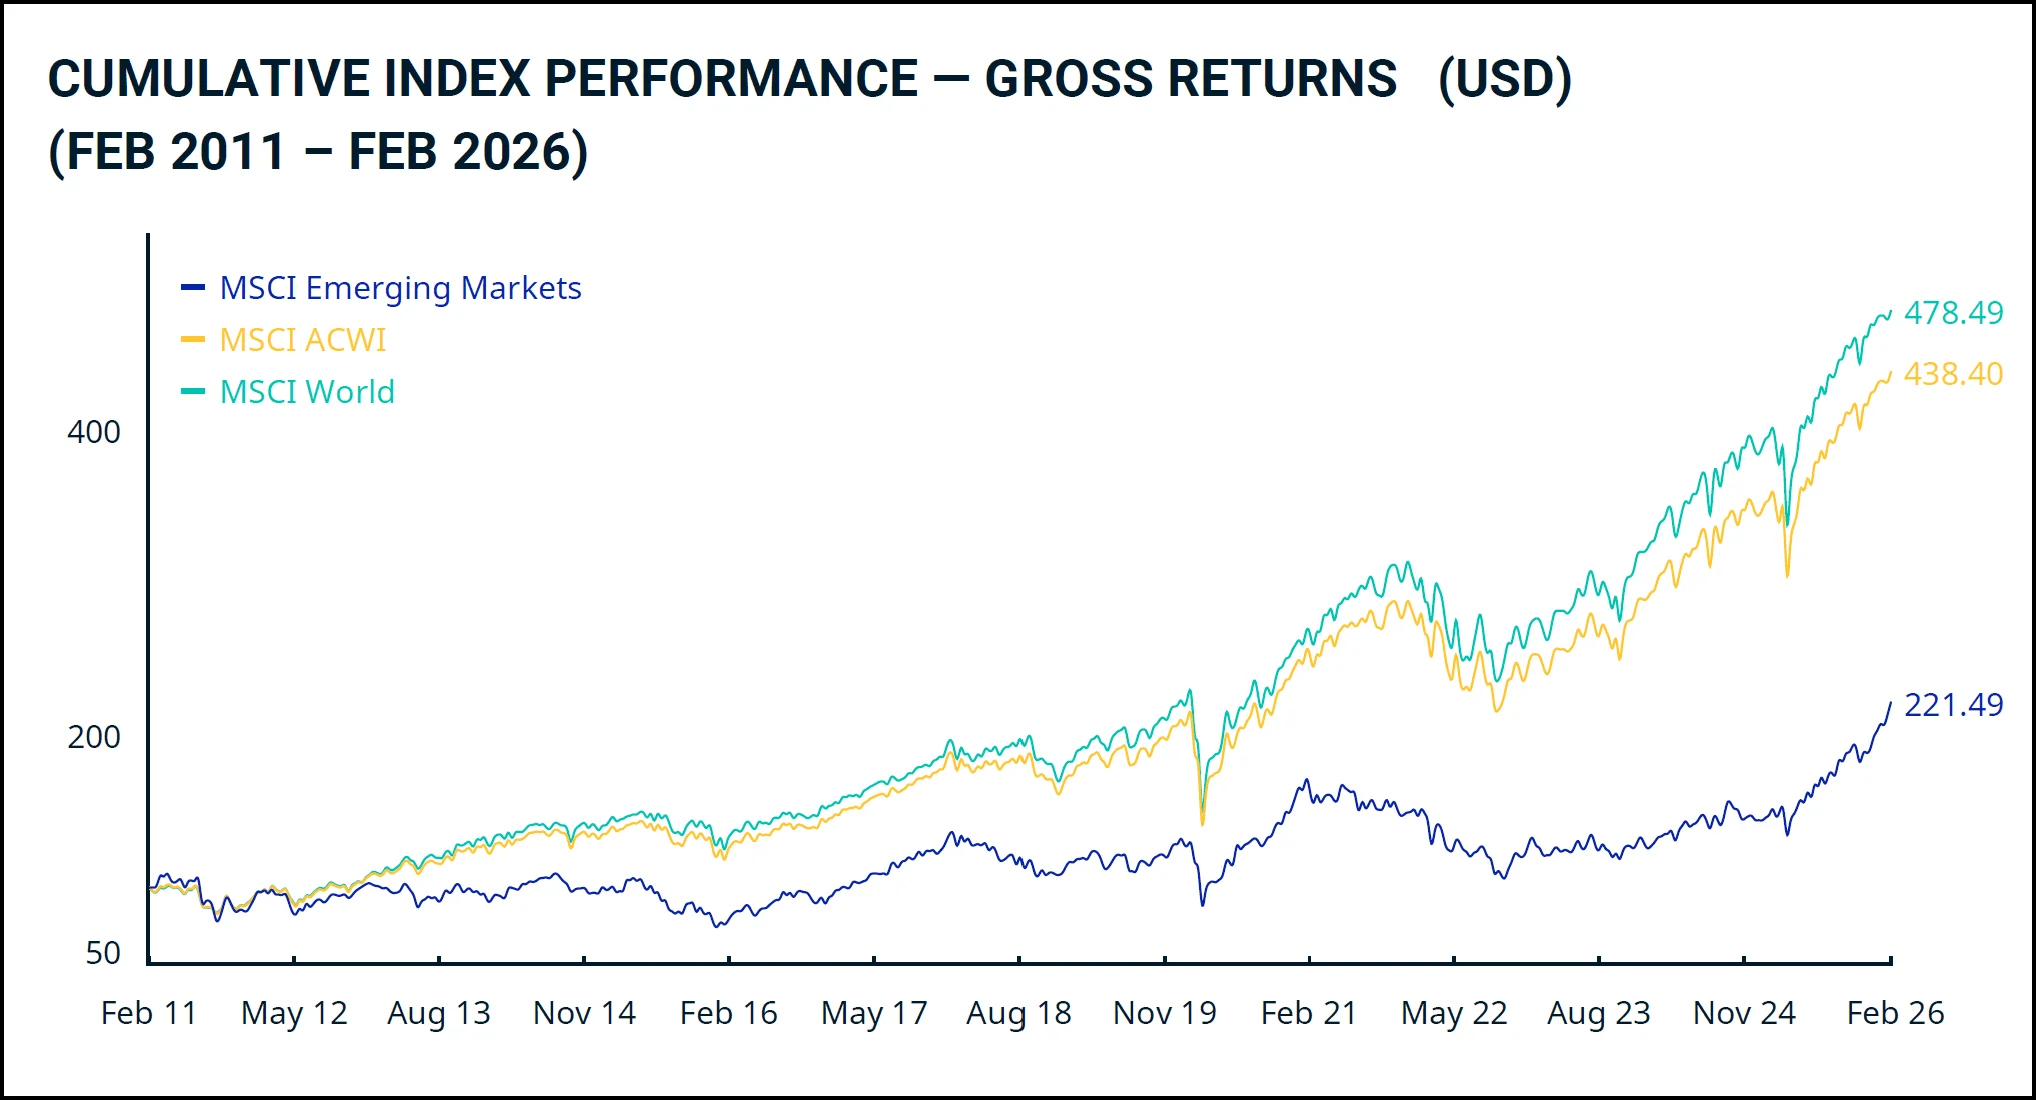
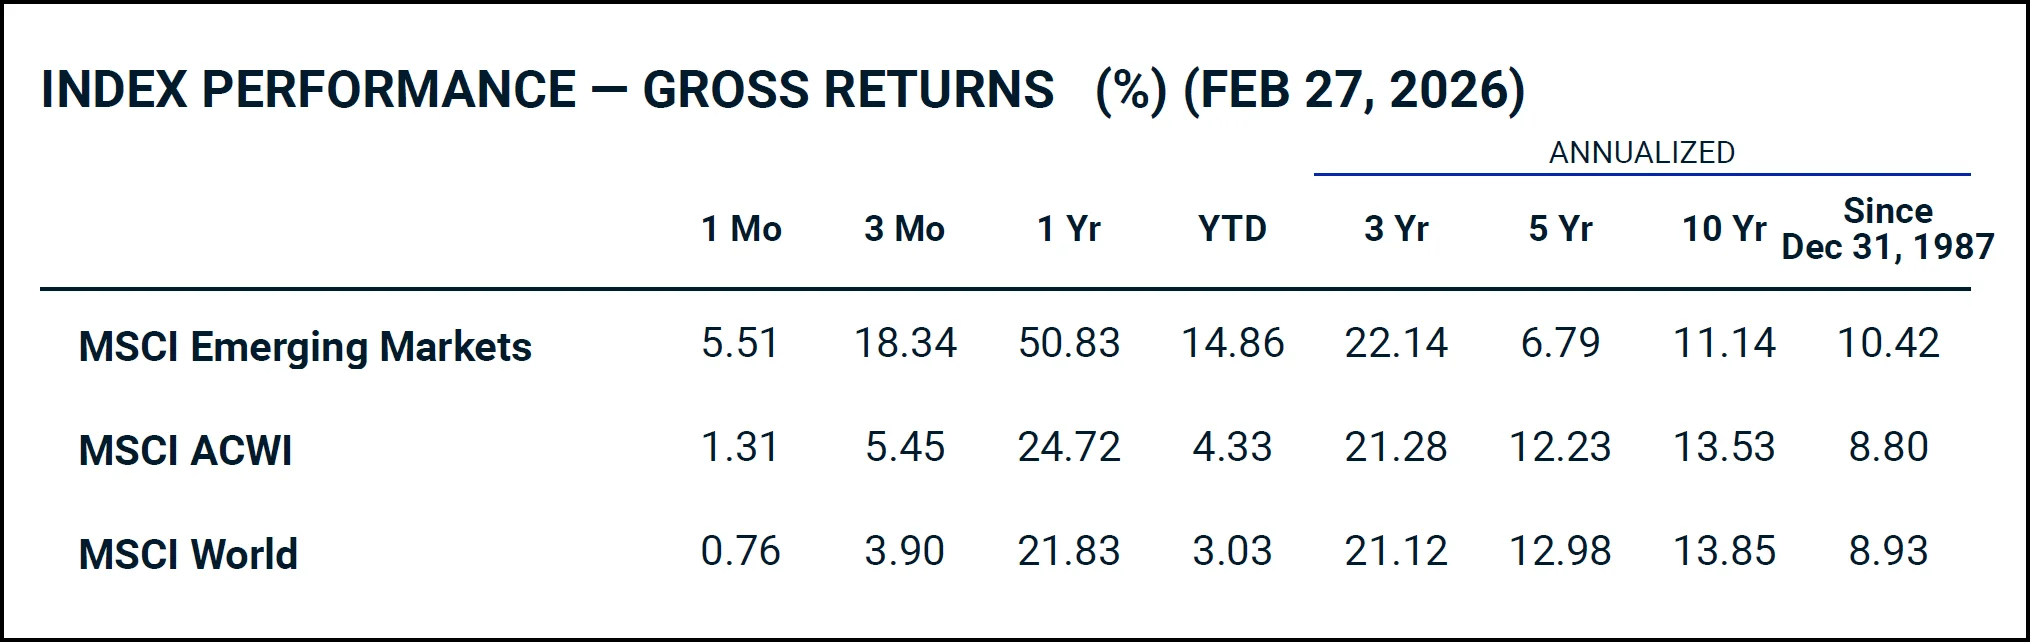
The Political Risk factor delivers in the long run: since the MSCI Emerging Markets Index was launched in December 1987, it has outperformed the global MSCI ACWI by 1.62 percentage points a year. So the premium exists – but it requires an exceptional amount of patience.
That’s because emerging markets tend to go through long and painful dry spells. The 15-year chart clearly shows that emerging market stocks lagged behind developed markets almost continuously from 2011 to the end of 2024 – more than a decade of underperformance. Anyone who lost their nerve and sold out during this phase missed the subsequent recovery. The annualised 5-year return of 6.79% compared with 12.23% for the MSCI ACWI underlines how persistent such phases can be.
If you aim for a global portfolio weighted by market capitalisation, you should have around 10% invested in emerging markets anyway – that is simply the weighting that matches the global stock market. If you also believe in the factor premium, you can deliberately overweight this share – but you should factor in the long dry spells and bring a correspondingly long investment horizon.
How to invest in the Political Risk factor
The range of emerging markets ETFs is pleasingly large and varied. You will find suitable products for Swiss investors in our big review Best ETFs in Switzerland and worldwide: And the winner is…
How do the five factors perform?
The only, but significant, advantage of factor investing is the excess return. This also applies – viewed over the (very) long term and to varying degrees – to the five factors described above. The table below shows the excess return per factor and over different periods.
| Period | Number of Years | Size Premium | Value Premium | Momentum Premium | Quality Premium | Political Risk Premium |
|---|---|---|---|---|---|---|
| 1975–2020 | 46 | 3,3% | 0,4% | – | – | – |
| 1975–1994 | 20 | 5,4% | 2,1% | – | – | – |
| 1995–2020 | 26 | 1,7% | -0,5% | 4,3% | 3,4% | 0,6% |
| 1975–1990 | 16 | 7,1% | 2,1% | – | – | – |
| 1991–2000 | 10 | -3,1% | 0,5% | – | – | 2,3% |
| 2001–2010 | 10 | 6,4% | 1,4% | 1,8% | -0,2% | 15,4% |
| 2011–2020 | 10 | 0,5% | -1,5% | 4,0% | 3,4% | -6,1% |
A few interesting points stand out:
- Size and Value have so far been studied most thoroughly and over the longest periods – the data series go back to 1975. This is also confirmed by the MSCI data, which is available for Value back to December 1974.
- The fluctuations are sometimes considerable. For example, political risk stocks underperformed by 6.1% between 2011 and 2020, after outperforming by 15.4% a year in the decade before. Our MSCI data confirms this picture: since December 1987, the long-term premium has still amounted to 1.62 percentage points a year – bought with extreme patience.
- At 4.3% over 26 years (1995–2020), the momentum premium remains the most attractive in this comparison. Our MSCI data confirms this too: since June 1994, the MSCI World Momentum has outperformed the overall market by 2.79 percentage points a year. At the other end of the spectrum, the Value factor even slipped into negative territory in the updated table (–0.5% over 26 years) – a finding reflected in our MSCI data: since 1974, the premium has amounted to a meagre 0.38 percentage points a year.
- Quality impresses with a stable 3.4% over 26 years – a finding impressively confirmed by our MSCI data: since June 1994, the MSCI World Quality has beaten the overall market by a strong 3.15 percentage points a year.
What are the disadvantages of factor investing?
But before you opt for factor investing, you should also know about its main drawbacks.
All five factors analysed share the following drawbacks:
- Higher costs (TER), even though prices have fallen sharply in recent years and most factor ETFs have now settled at 0.25–0.35% p.a.
- Small product range – especially for the Momentum factor, the choice of ETFs is still limited
- Longer dry spells in returns than with a market-cap-weighted investment require a greater tolerance for pain and more staying power – as the Kommer table clearly shows, individual factors can be negative for an entire decade
The Value factor also has the following additional drawbacks:
- No significant excess return in the last three decades – our MSCI data confirms this: since 1974, the long-term premium has been a meagre 0.38 percentage points a year – effectively zero after costs
- Above-average tax burden for Swiss investors, as the distributed share of total performance is higher for value stocks than for the overall market and the other four factors (see article Dividend strategy doesn’t pay off!).
Where can you buy factor ETFs?
The factor ETFs presented are available from most established online brokers. You are in particularly good hands with the following four, which we have tested in detail and recommend:
Saxo | Swissquote | DEGIRO | Interactive Brokers
Note: Saxo is particularly attractive for iShares ETFs: its ETF savings plans let you buy selected iShares products without purchase fees – including, for example, the iShares Edge MSCI World Quality Factor ETF. A clear advantage for anyone who wants to invest in factor premiums automatically and cost-efficiently.
– Partner offer –
– – – – –
On our compact recommendations page, you will find the key information on our preferred online brokers, including sign-up bonuses.
Conclusion
We sum up our conclusions in the following five points:
- Factor investing can lead to an excess return in the long run and is generally worth considering – but it is not a must. If you decide to go for it, you should only use factor ETFs as an addition to your core portfolio, not as a complete replacement for a broad market ETF. A simpler and cheaper alternative remains an investment in the overall market anyway.
- Momentum and Quality stand out as by far the most attractive factors: since 1994, both have outperformed the overall market by around 3 percentage points a year. Political Risk and Small Size are also positive, but their premiums are more modest. The Value factor disappoints: after more than 50 years of research, the long-term premium after costs and taxes is effectively zero – so you can hardly speak of a noticeable premium any more.
- The range of factor ETFs has improved in recent years and costs have fallen. Even so, factor ETFs are still more expensive than market-cap-weighted ETFs – something you should take into account when deciding.
- The excess returns of the five factors examined have been scientifically confirmed over long periods. But there is no guarantee whatsoever that this will also hold true in the future – most factor premiums have tended to weaken after their scientific discovery.
- Factor investing requires iron discipline: individual factors can be negative for an entire decade. If you can’t sit through these dry spells, you are better off with a simple global market ETF.
You might also be interested in

Updates
2026-03-26: Minor changes made.
2026-03-18: Text and charts comprehensively updated.
Disclaimer
Disclaimer: Investing involves the risk of loss. You have to decide for yourself whether or not you want to take these risks.
Errors excepted: We have written this article to the best of our knowledge and belief. Our goal is to provide you as a private investor with information on finance that is as objective and meaningful as possible. Should we nevertheless have made mistakes, forgotten important aspects or should information no longer be up to date, we would be grateful for your feedback.
About the authors

Stefan Huser
Stefan has been investing in the stock market himself since 2015. He has been shaped by Markowitz’s portfolio theory and Gerd Kommer’s book “Souverän investieren”. He follows a core-satellite strategy: a global equity portfolio of ETFs forms the core, complemented by alternative investments. At the blog, he mainly takes care of the writing. Stefan lives with his family in Zurich and is interested in literature, photography and financial freedom.

Antun Brcina
Antun (“Toni”) has been investing in the stock market since 2015. Financially, he has been particularly inspired by Gerd Kommer’s book “Souverän investieren” and the Fama-French five-factor model. His money is invested in a broadly diversified, long-term global equity portfolio of ETFs. At the blog, he mainly works on the calculators and the code. Toni lives with his family in the Zurich area and is interested in sports, technology and entrepreneurship.





15 Comments
Hallo Toni und Stefan,
in eurem Blogbeitrag “Bester ETF 2026” erwähnt ihr, dass ihr ausschliesslich ETFs mit einer TER von unter 0,20 % nutzt. Mich würde interessieren, ob ihr diese Regel auch tatsächlich in euren eigenen Portfolios umsetzt. Zum Beispiel habt ihr beide Small Cap World ETFs, während der günstigste mir bekannte MSCI World Small Caps von iShares eine TER von 0,35 % aufweist.
Ausserdem interessiert mich, warum Toni keinen Anteil an Schweizer Aktien in seinem Portfolio hat. Könnte es daran liegen, dass der Anteil an Schweizer Werten bereits durch AHV, PK und Säule 3a höher ist? Last but not least, gibt es einen speziellen Grund, warum ihr BTC oder Gold ETFs in eurer Anlagestrategie nicht berücksichtigt?
Vielen Dank und beste Grüsse,
Marco
Hoi Marco
Vielen Dank für dein Interesse.
Zum Punkt TER: Beim besagten Blogbeitrag geht es nicht um unser persönliches Portfolio, sondern um einen ETF-Vergleich mit klar definierten Selektionskriterien – u.a. einer maximalen TER von 0,20%. Im Fokus stehen dabei bewusst die klassischen „Brot-und-Butter-ETFs“. Factor-ETFs liegen in der Regel darüber und eignen sich als Beimischung zu marktbreiten ETFs – entsprechend ist das kein Widerspruch zu unseren persönlichen Portfolios.
Zu den Small Caps: Hier akzeptieren wir bewusst eine höhere TER, da wir auf die zusätzliche Faktorprämie abzielen.
Zum Schweiz-Anteil: Toni vermeidet einen Home Bias bzw. eine Übergewichtung der Schweiz. Schweizer Unternehmen sind in globalen ETFs ohnehin enthalten.
Zu BTC / Gold: Wir setzen im Kern auf breit diversifizierte, produktive Anlagen (Aktien). Gold oder Bitcoin sehen wir – wenn überhaupt – als optionale Beimischung.
Beste Grüsse
SFB
VT Vanguard Total World Stock ETF 46.00%
AVUV Avantis US Small Cap Value ETF 10.00%
SLICHA:CH UBS ETF (CH) SLI (CHF) A-dis 30.00%
AVDV Avantis International Small Cap Val ETF 6.00%
AVES Avantis Emerging Markets Value ETF 8.00%
Was hält ihr von einem solchen Portfolio? Die Dividenden sind nicht wesentlich höher als nur mit dem VT. Nur momentum fehlt, was würdet ihr dafür empfehlen?
Findet man euer Portfolio irgendwo?
Mit diesem Portfolio bist du breit/global diversifiziert, was unserer Anlagephilosophie entspricht. Die in deinem Portfolio enthaltenen Avantis Produkte, sind jedoch eher klein (Fondsvolumen) und/oder teuer (TER). Deshalb würden wir hier etablierte Anbieter wie Vanguard oder iShares vorziehen. ETF mit Faktor “Momentum”: Ein auf dem Markt interessantes Produkt mit hohem Fondsvolumen zum fairen Preis (0,25%) ist der iShares Momentum ETF (IE00BP3QZ825). Die aktuelle Asset Allocation bei Aktien-ETFs von Toni: 75% MSCI World; 15% MSCI World Small Caps; 10% MSCI Emerging Markets; von Stefan: 25% CH; 15% Europa ex-CH; 25% Nordamerika; 15% Asien-Pazifik; 20% Emerging Markets; (alles aufgeteilt in 75% Large Caps und 25% Mid-/Small-Caps). Dies lediglich zur Information; d.h. keine Anlageberatung.
Die Avantis ETF’s haben ein TER von 0.25% resp. 0.36%. Das ist gleich oder leich über dem von euch als fairen Preis bezeichneten gerade empfohlenen iShares Momentum ETF. Der TER über das gesamte Portfolio ist wegen der relativ kleinen % anteile auch nur 0.1524%.
Man kann sich auf portfoliovisualizer.com die factor exposure der einzelnen ETFs anzeigen lassen, und das sind so ziemlich die besten, die es gibt. Wenn man von Faktor Investieren überzeugt ist, dan ist der kleine (~0.1%) unterschied in Spesen wirklich irrelevant. Nur bei AVES stimme ich eventuell überein, dass er etwas klein ist, aber es gibt halt fast keine Emerging Markets Small CAP ETFs.
Vielen Dank für eure Asset Allocation.
Hallo zusammen
Wie habt ihr Faktoren wie Small Size, Momentum oder auch Quality in euren Portfolios integriert? Ergänzt ihr ein grundlegend globales Portfolio, wie z. B. World developed & EM (political risk), mit diesen Faktoren, also mittels Beifügen eines entsprechende ETFs von z. B. 5-10% oder baut ihr dann ein Portfolio komplett auf diesen Faktoren gleichgewichtet auf, sowie es auch Kommer in seinem Buch im Falle von Portfolios mit Faktoren vorschlägt? (Bsp.: 4 Faktoren jeweils zu 25 % oder alternativ noch Beimischung von Rohstoffen oder Immobilien ETFs). Letzteres erscheint mir doch eine sehr aggressive Einbindung der Faktoren. Aber vielleicht braucht es ja gerade das, um überhaupt einen merklichen Unterschied zum klassischen marktneutralen Portfolio zu erzeugen. Oder wie sehr ihr das?
Allgemein finde das Investieren mittels Faktoren einen interessanten Ansatz, jedoch bin ich auch ein bisschen kritisch eingestellt, da das Ganze für mich den Eindruck erweckt, Züge aktiven Investierens zu beinhalten (mit den üblichen kritischen Punkten wie market timing, performance chasing, etc.), auch wenn behauptet wird, dass der Vorteil der Faktoren wissenschaftlich belegt ist. Zudem scheint es praktisch nicht umsetzbar zu sein gleichzeitig auf diverse Faktoren zu setzten und dennoch möglichst über alle Regionen hinweg investiert zu sein, da man dann schnell über 10 ETFs benötigt. Demzufolge hat man beim Investieren mit Faktoren wieder das Problem der starken US Übergewichtung (Portfolio nach Marktkapitalisierung). Wie geht ihr mir dieser Problematik um?
Ich freue mich auf eure Rückmeldung.
Liebe Grüsse
Fabian
Hoi Fabian
Bei uns sind ausgewählte Faktoren (Stefan: Small Cap, Political Risk; Toni: Small Cap, Momentum) in unsere Portfolios integriert. Konkret heisst das, dass Toni z.B. anstelle eines marktneutralen MSCI World ETF nur einen MSCI World Momentum ETF im Portfolio hat. Zu beachten ist, dass Faktoren erst dann Faktoren werden, wenn sie gegenüber dem marktneutralen Portfolio übergewichtet sind. Das heisst, z.B. bei den Emerging Markets (Faktor “Political Risk”) müsste der Anteil grösser als 10% sein, da die Emerging Markets “marktneutral” gewichtet nach Marktkapitalisierung etwa 10% ausmachen.
Beste Grüsse
SFB
Hallo zusammen,
zuerst einmal vielen Dank für eure ausführlichen Berichte. Ich finde diese stets sehr interessant.
Nun möchte ich Factor Investing betreiben und in einen entsprechenden ETF investieren.
Nach Gerd Kommer wird empfohlen in einen Multi-Faktor ETF zu investieren und bin nun auf der Suche auf drei ETFS getroffen:
– iShares Edge MSCI World Multifactor UCITS ETF CHF Hedged (Acc) (IE00BF450720)
– iShares Edge MSCI World Multifactor UCITS ETF USD (Acc) (IE00BZ0PKT83)
– JPM Global Equity Multi-Factor UCITS ETF – USD (Acc) (IE00BJRCLL96)
Bezüglich den Auswahlkriterien tue ich mir gerade etwas schwer.
– Wie zentral ist eine Währungsabsicherung USD in CHF beim Factor Investing?
– Welche Priosierung der Auswahlkriterien ist sinnvoll?
– Tracking Difference
– TER
– Fondsvolumen
– Anzahl Titel im ETF
– Anzahl Faktorprämien im ETF
– Zeitdauer ETF
Ich danke euch für eure Rückmeldung.
Lieber Gruss
René
Hoi René
Wir würden uns für keinen der drei ETFs entscheiden. Und zwar nicht etwa, weil wir per se gegen Multi-Faktor-ETFs wären, sondern weil Produktauswahl und Nachfrage einfach noch zu dürftig sind. Dies schlägt sich in hohen Preisen und/oder in geringen Fondsgrössen nieder. So sind für uns die beiden iShares Produkte mit einer TER von 0,55% resp. 0,50% zu teuer. Der JPM ETF ist mit einer TER von 0,20% deutlich günstiger. Letzterer ist jedoch erst seit gut drei Jahren auf dem Markt und hat die Schwelle von 100 Mio. CHF Fondsvermögen noch nicht erreicht. Zudem gefällt uns nicht, dass der zugrunde liegende Index beim JPM-Produkt nicht unabhängig (wie z.B. die auf dem Markt etablierten Indizes MSCI oder FTSE), sondern offensichtlich ein “Eigenbau” ist.
Wir haben in unseren Portfolios ebenfalls Faktoren wie “Small Size”, “Political Risk” und “Momentum”), jedoch mittels separaten ETFs. Welche Kriterien wir bei der ETF-Auswahl für wichtig erachten, erfährst du in diesem oder diesem Artikel. Währungsabsicherung gehört nicht dazu.
Beste Grüsse
SFB
Danke für den interessanten Bericht! Möchte nur anmerken, dass die 5 genannten Faktoren keine definitive Liste sind – die Faktorenforschung geht munter weiter und produzierte bisher an die 100 mögliche Faktoren, die sich natürlich überlappen (z.B. Profitabilität, Dividendenausschütter, Qualität).
Neuere Erkenntnisse deuten übrigens darauf hin, dass die Small Size Prämie nicht existent ist. Das entsprechende Paper hat Rolf Banz 1980 geschrieben, zu diesem Zeitpunkt enthielt die historische Kursdatenbank CRSP keine korrekten Schlusskurse für Unternehmen, die von der Börse genommen wurden (z.B. wegen Pleite). Small Caps waren von diesem Datenfehler besonders häufig betroffen. Das Paper “Fact, Fiction and the Size Effect” (2018) legt nahe, dass es keine statistisch relevante Prämie für Small Caps Aktien gibt.
Wenn man in Faktor-ETFs investiert, sollte man bedenken, dass diese eine gigantische Rotation an enthaltenen Aktientiteln haben. Der MSCI World Momentum tauschte in den letzten 12 Monaten 149% seiner 350 Titel aus, der MSCI World nur 3,2% der 1600 Aktien. Die vielen Verkäufe können bei Kursgewinnen auch zu Steuerbelastung führen.
Danke Franz für deinen Kommentar. Wir denken jedoch nicht und unsere mehrjährige Erfahrung bestätigt dies, dass ein Investment in einen Momentum-ETF für den Privatanleger zusätzliche Steuerbelastungen generiert. Du führst ja in diesem Fall diese – wie du es nennst – “gigantische Rotation” nicht selber aus, sondern diese Transaktionen erfolgen regelbasiert durch den ETF-Anbieter. Dafür zahlst du dann eine etwas höhere TER.
Beste Grüsse SFB
Danke für die klärende und übersichtliche Zusammenfassung! Zudem danke für den Blickwinkel aus der Schweiz (für Schweizer ist Value wenig attraktiv)
Herzlichen Dank für den Beitrag. Mittlerweile ist mir schon klar, warum immer wieder von einem Finanz-Dschungel gesprochen wird 🙂
Aber u.a. dank euch, bekomm ich langsam einen Durchblick 🙂
Vielen Dank für deinen Kommentar, Andy. Es freut uns (und entspricht unserer Mission), dass du durch diesen Artikel wieder etwas mehr Durchblick im “Finanz-Dschungel” erlangt hast🙂
Beste Grüsse
SFB
Herzlichen Dank für den wahnsinnig ausführlichen Bericht.
Das hat mir weitergeholfen!
Weiter so.
Mit den besten Grüßen
Christoph